
Page 20 - Adsorption, Ion Exchange & Catalysis- 2007, Elsevier - Copy
P. 20
Else_AIEC-INGLE_Ch001.qxd 7/13/2006 1:53 PM Page 16
16 1. Air and ater Pollution W
occurrence of bushfires or hazard reduction burning in the vicinity of the cities. Hopefully,
even then, the current standards are not actually expected to be exceeded (Australian
Academy of Technological Sciences and Engineering, 1997).
1.1.2 Water pollution
Water covers 71% of the planet’s surface, mainly in the form of salty water in the oceans.
, It is a vital substance for supporting life on Earth. For example, a tree contains 60% w ater
ater
,
most animals are composed of about 65% w while our bodies contain around 55%
water (Tyler Miller, 1999). Everyone needs fresh water everyday to cover the daily demand
in food, domestic use, etc. Fresh water is used in agriculture, construction, transport, the
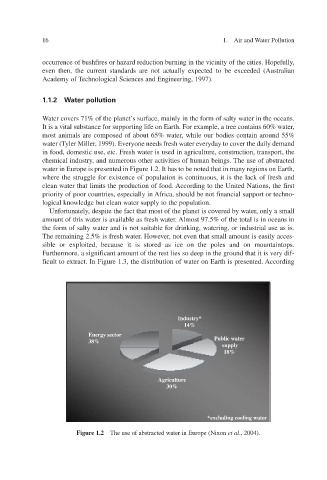
chemical industry, and numerous other activities of human beings. The use of abstracted
water in Europe is presented in Figure 1.2. It has to be noted that in many regions on Earth,
where the struggle for existence of population is continuous, it is the lack of fresh and
clean water that limits the production of food. According to the United Nations, the f irst
priority of poor countries, especially in should be not financial support or techno- Africa,
logical knowledge but clean water supply to the population.
Unfortunately, despite the fact that most of the planet is coered by w only a small v , ater
amount of this water is aailable as fresh wAlmost 97.5% of the total is in oceans in ater . v
atering,
the form of salty water and is not suitable for drinking, w or industrial use as is.
,
er
v
The remaining 2.5% is fresh w not een that small amount is easily acces- ater v
. Ho
we
xploited,
sible or e because it is stored as ice on the poles and on mountaintops.
Furthermore, a significant amount of the rest lies so deep in the ground that it is very dif-
ficult to extract. In Figure 1.3, the distribution of water on Earth is presented. According
Industry*
14%
Energy sector
Public water
38%
supply
18%
Agriculture
30%
*excluding cooling water
Figure 1.2 The use of abstracted water in Europe (Nixon et al ., 2004).