
Page 15 - Adsorption, Ion Exchange & Catalysis- 2007, Elsevier - Copy
P. 15
Else_AIEC-INGLE_Ch001.qxd 7/13/2006 1:53 PM Page 11
1.1 Introduction 11
measures that will be taken have to be focused not only on road transport but also on com-
bustion installations.
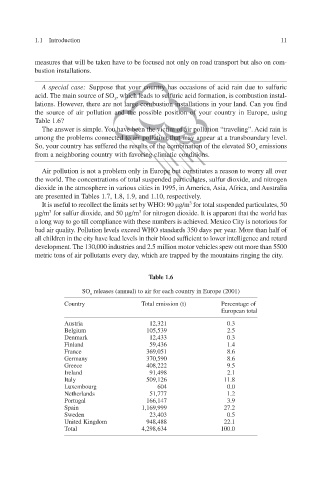
A special case: Suppose that your country has occasions of acid rain due to sulfuric
acid. The main source of SO , which leads to sulfuric acid formation, is comb ustion instal-
x
v
we
lations. Hoer, there are not large combustion installations in your land. Can you f ind
the source of air pollution and the possible position of your country in Europe, using
Table 1.6?
The answer is simple. You have been the victim of air pollution “traveling”. Acid rain is
among the problems connected to air pollution that may appear at a transboundary le el. v
So, your country has suf fered the results of the combination of the ele v ated SO emissions
x
from a neighboring country with f oring climatic conditions. v a
Air pollution is not a problem only in Europe but constitutes a reason to worry all o er v
the world. The concentrations of total suspended particulates, sulfur dioxide, and nitrogen
America, dioxide in the atmosphere in various cities in 1995, in Asia, Africa, and Australia
are presented in Tables 1.7, 1.8, 1.9, and 1.10, respecti . v ely
It is useful to recollect the limits set by WHO: 90 g/m 3 for total suspended particulates, 50
g/m 3 for sulfur dioxide, and 50 g/m 3 for nitrogen dioxide. It is apparent that the world has
a long way to go till compliance with these numbers is achieved. Mexico City is notorious for
bad air quality. Pollution levels exceed WHO standards 350 days per year. More than half of
all children in the city have lead levels in their blood sufficient to lower intelligence and retard
development. The 130,000 industries and 2.5 million motor vehicles spew out more than 5500
metric tons of air pollutants every day, which are trapped by the mountains ringing the city.
Table 1.6
SO x releases (annual) to air for each country in Europe (2001)
Country Total emission (t) Percentage of
European total
Austria 12,321 0.3
Belgium 105,539 2.5
Denmark 12,433 0.3
Finland 59,436 1.4
France 369,051 8.6
Germany 370,590 8.6
Greece 408,222 9.5
Ireland 91,498 2.1
Italy 509,126 11.8
Luxembourg 604 0.0
Netherlands 51,777 1.2
Portugal 166,147 3.9
Spain 1,169,999 27.2
Sweden 23,403 0.5
United Kingdom 948,488 22.1
Total 4,298,634 100.0