
Page 16 - Adsorption, Ion Exchange & Catalysis- 2007, Elsevier - Copy
P. 16
Else_AIEC-INGLE_Ch001.qxd 7/13/2006 1:53 PM Page 12
12 1. Air and ater Pollution W
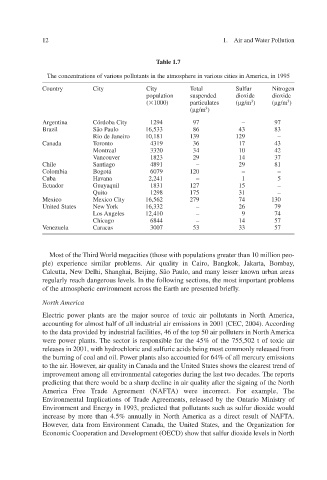
Table 1.7
The concentrations of various pollutants in the atmosphere in various cities in in 1995 America,
Country City City Total Sulfur Nitrogen
population suspended dioxide dioxide
( 1000) particulates ( g/m 3 ) ( g/m 3 )
( g/m 3 )
Argentina Córdoba City 1294 97 – 97
Brazil São P aulo 16,533 86 43 83
Rio de Janeiro 10,181 139 129 –
Canada Toronto 4319 36 17 43
Montreal 3320 34 10 42
Vancouver 1823 29 14 37
Chile Santiago 4891 – 29 81
Colombia Bogotá 6079 120 – –
Cuba Havana 2,241 – 1 5
Ecuador Guayaquil 1831 127 15 –
Quito 1298 175 31 –
Mexico Mexico City 16,562 279 74 130
United States New York 16,332 – 26 79
Los Angeles 12,410 – 9 74
Chicago 6844 – 14 57
Venezuela Caracas 3007 53 33 57
Most of the Third World megacities (those with populations greater than 10 million peo-
ple) experience similar problems. Air quality in Cairo, Bangk Jakarta, Bombay ,
ok,
Calcutta, New Delhi, Shanghai, Beijing, São P and many lesser known urban areas
aulo,
regularly reach dangerous leels. In the following sections, the most important problems
v
of the atmospheric environment across the Earth are presented briefly .
North America
Electric power plants are the major source of toxic air pollutants in North America,
accounting for almost half of all industrial air emissions in 2001 (CEC, 2004). According
to the data provided by industrial facilities, 46 of the top 50 air polluters in North America
were power plants. The sector is responsible for the 45% of the 755,502 t of toxic air
releases in 2001, with hydrochloric and sulfuric acids being most commonly released from
the burning of coal and oil. Power plants also accounted for 64% of all mercury emissions
to the air. However, air quality in Canada and the United States shows the clearest trend of
improvement among all environmental categories during the last two decades. The reports
predicting that there would be a sharp decline in air quality after the signing of the North
America Free Trade Agreement (NAFTA) were incorrect. For example, The
Environmental Implications of TAgreements, released by the Ontario Ministry of
rade
Environment and Energy in 1993, predicted that pollutants such as sulfur dioxide w ould
increase by more than 4.5% annually in North America as a direct result of N A. AFT
However, data from Environment Canada, the United States, and the Organization for
Economic Cooperation and Development (OECD) show that sulfur dioxide levels in North