
Page 11 - Adsorption, Ion Exchange & Catalysis- 2007, Elsevier - Copy
P. 11
Else_AIEC-INGLE_Ch001.qxd 7/13/2006 1:53 PM Page 7
1.1 Introduction 7
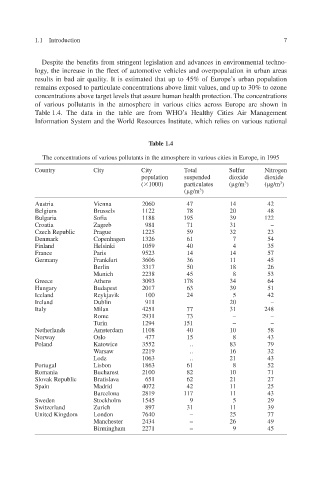
Despite the benefits from stringent legislation and advances in environmental techno-
v
logy, the increase in the fleet of automotie vehicles and oerpopulation in urban areas v
results in bad air quality. It is estimated that up to 45% of Europe’s urban population
remains exposed to particulate concentrations aboe limit v and up to 30% to ozone alues, v
concentrations above target levels that assure human health protection. The concentrations
of various pollutants in the atmosphere in various cities across Europe are shown in
Table 1.4. The data in the table are from WHO’s Healthy Cities Air Management
Information System and the World Resources Institute, which relies on various national
Table 1.4
The concentrations of various pollutants in the atmosphere in various cities in Europe, in 1995
Country City City Total Sulfur Nitrogen
population suspended dioxide dioxide
( 1000) particulates ( g/m 3 ) ( g/m 3 )
( g/m 3 )
Austria Vienna 2060 47 14 42
Belgium Brussels 1122 78 20 48
Bulgaria Sofia 1188 195 39 122
Croatia Zagreb 981 71 31 –
Czech Republic Prague 1225 59 32 23
Denmark Copenhagen 1326 61 7 54
Finland Helsinki 1059 40 4 35
France Paris 9523 14 14 57
Germany Frankfurt 3606 36 11 45
Berlin 3317 50 18 26
Munich 2238 45 8 53
Greece Athens 3093 178 34 64
Hungary Budapest 2017 63 39 51
Iceland Reykjavik 100 24 5 42
Ireland Dublin 911 20 –
Italy Milan 4251 77 31 248
Rome 2931 73 – –
Turin 1294 151 – –
Netherlands Amsterdam 1108 40 10 58
Norway Oslo 477 15 8 43
Poland Katowice 3552 .. 83 79
Warsaw 2219 .. 16 32
Lodz 1063 .. 21 43
Portugal Lisbon 1863 61 8 52
Romania Bucharest 2100 82 10 71
Slovak Republic Bratislava 651 62 21 27
Spain Madrid 4072 42 11 25
Barcelona 2819 117 11 43
Sweden Stockholm 1545 9 5 29
Switzerland Zurich 897 31 11 39
United Kingdom London 7640 – 25 77
Manchester 2434 – 26 49
Birmingham 2271 – 9 45