
Page 306 - Adsorption, Ion Exchange & Catalysis- 2007, Elsevier - Copy
P. 306
Else_AIEC-INGLE_cH004.qxd 7/1/2006 6:53 PM Page 302
302 4. Adsorption and Ion Exchange
Solution
The finite solution volume model for solid-diffusion control (Ps model) will be atterson’
used (eq. (4.52)). Following the procedure presented in the section Design of a batch reac-
tor system for adsorption and ion e hang xc e (eqs. (4.119)–(4.125)), we obtain the results
shown in Table 4.23.
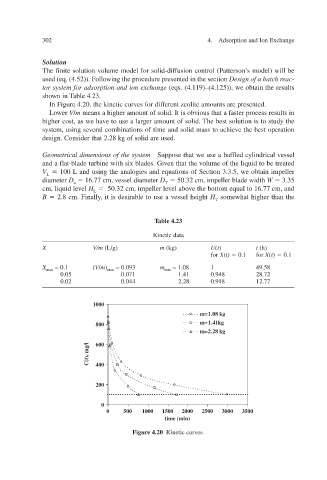
In Figure 4.20, the kinetic curves for different zeolite amounts are presented.
Lower V / m means a higher amount of solid. It is obvious that a faster process results in
v
higher cost, as we hae to use a larger amount of solid. The best solution is to study the
system, using seeral combinations of time and solid mass to achiee the best operation v
v
design. Consider that 2.28 kg of solid are used.
Geometrical dimensions of the system Suppose that we use a baffled cylindrical v essel
and a flat-blade turbine with six blades. Gien that the volume of the liquid to be treated v
V L 100 L and using the analogies and equations of Section 3.3.5, we obtain impeller
diameter D a 16.77 cm, v essel diameter D T 50.32 cm, impeller blade width W 3.35
cm, liquid le el v H L 50.32 cm, impeller leel aboe the bottom equal to 16.77 cm, and v
v
,
B 2.8 cm. Finally it is desirable to use a vessel height H T somewhat higher than the
Table 4.23
Kinetic data
X V/m (L/g) m (kg) U ( t ) t (h)
for X ( t ) 0.1 for X ( t ) 0.1
X max = 0.1 ( V / m ) max = 0.093 m min = 1.08 1 49.58
0.05 0.071 1.41 0.948 28.72
0.02 0.044 2.28 0.918 12.77
1000
m=1.08 kg
800 m=1.41kg
m=2.28 kg
600
400
C(t), mg/l
200
0
0 500 1000 1500 2000 2500 3000 3500
time (min)
Figure 4.20 Kinetic curv es.