
Page 74 - Advanced Design Examples of Seismic Retrofit of Structures
P. 74
66 Advanced Design Examples of Seismic Retrofit of Structures
d ix and d iy ¼distance of ith wall from the assumed reference point in in X-
and Y-direction, respectively.
For the X-coordinate of COR:
6:79E +9
X CR 1 ¼ ¼ 8:92m
7:61E +8
3:05E +9
X CR 2 ¼ ¼ 8:83m
3:46E +8
For the Y-coordinate of COR:
1:85 + 10
Y CR 1 ¼ ¼ 22:60 m
8:19E +8
9:74E +9
Y CR 2 ¼ ¼ 9:01m
01E +4:43
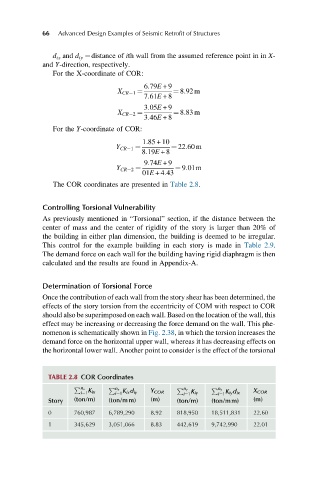
The COR coordinates are presented in Table 2.8.
Controlling Torsional Vulnerability
As previously mentioned in “Torsional” section, if the distance between the
center of mass and the center of rigidity of the story is larger than 20% of
the building in either plan dimension, the building is deemed to be irregular.
This control for the example building in each story is made in Table 2.9.
The demand force on each wall for the building having rigid diaphragm is then
calculated and the results are found in Appendix-A.
Determination of Torsional Force
Once the contribution of each wall from the story shear has been determined, the
effects of the story torsion from the eccentricity of COM with respect to COR
should also be superimposed on each wall. Based on the location of the wall, this
effect may be increasing or decreasing the force demand on the wall. This phe-
nomenon is schematically shown in Fig. 2.38, in which the torsion increases the
demand force on the horizontal upper wall, whereas it has decreasing effects on
the horizontal lower wall. Another point to consider is the effect of the torsional
TABLE 2.8 COR Coordinates
P P P n y P n y
n x K n x K
K
K
i¼1 ix i¼1 ix d iy Y COR i¼1 iy i¼1 iy d ix X COR
Story (ton/m) (ton/mm) (m) (ton/m) (ton/mm) (m)
0 760,987 6,789,290 8.92 818,950 18,511,831 22.60
1 345,629 3,051,066 8.83 442,619 9,742,990 22.01