
Page 53 - Advanced Gas Turbine Cycles
P. 53
30 Advanced gas turbine cycles
T
0 S
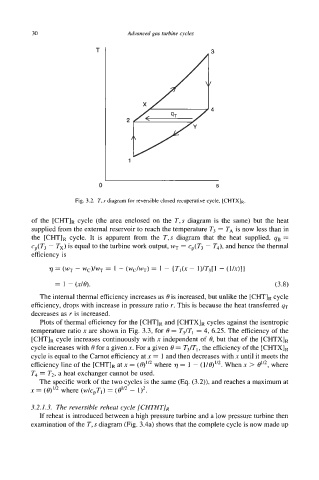
Fig. 3.2. T, s diagram for reversible closed recuperative cycle, [CHTXIR.
of the [cHT]R cycle (the area enclosed on the T,s diagram is the same) but the heat
supplied from the external reservoir to reach the temperature T3 = TA is now less than in
the [Cm]R cycle. It is apparent from the T,s diagram that the heat supplied, qB =
cp(T3 - Tx) is equal to the turbine work output, wT = cp(T3 - T4), and hence the thermal
efficiency is
T/=(WT-WC)/WT= 1 -(WC/WT)= 1 - (Tl(X- 1)/T3[1 -(I/X)])
= 1 - (x/e). (3.8)
The internal thermal efficiency increases as 8 is increased, but unlike the [GHTIR cycle
efficiency, drops with increase in pressure ratio r. This is because the heat transferred qT
decreases as r is increased.
Plots of thermal efficiency for the [CHT], and [ m ] R cycles against the isentropic
temperature ratio x are shown in Fig. 3.3, for 8 = T3/Tl = 4, 6.25. The efficiency of the
[CHT], cycle increases continuously with x independent of 8, but that of the [Cm]R
cycle increases with 8 for a given x. For a given 8 = T3/T1, the efficiency of the [cHTx]R
cycle is equal to the Carnot efficiency at x = 1 and then decreases with x until it meets the
efficiency line of the [cHT]R at x = (e)'" where 7 = 1 - (I/@". When x > eln, where
T4 = T2, a heat exchanger cannot be used.
The specific work of the two cycles is the same (Q. (3.2)), and reaches a maximum at
x = where (wlcpTl) = (eln - 1>2.
3.2.1.3. The reversible reheat cycle [CHTHT],
If reheat is introduced between a high pressure turbine and a low pressure turbine then
examination of the T, s diagram (Fig. 3.4a) shows that the complete cycle is now made up