
Page 68 - Advanced Gas Turbine Cycles
P. 68
44 Advanced gas turbine cycles
55
50
48
5
tiu
2
$35
Y
Y
Ym
4
2 25
z
20
15
10
800 800 looo 1200 1400 1600 1800 Moo 2200 2400
MAXIMUM TEMPERATURE ( "C)
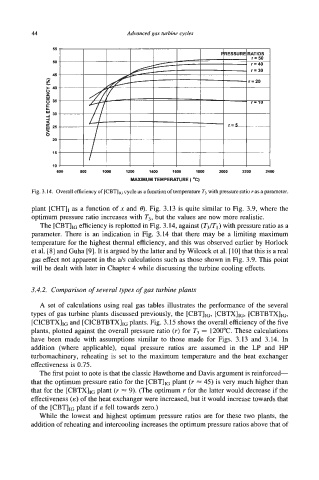
Fig. 3.14. Overall efficiency of [CBVI~ cycle as a function of temperature T3 with pressure ratio r as a parameter.
plant [CHTII as a function of x and e). Fig. 3.13 is quite similar to Fig. 3.9, where the
optimum pressure ratio increases with T3, but the values are now more realistic.
The [CBTIIG efficiency is replotted in Fig. 3.14, against (T3/T1) with pressure ratio as a
parameter. There is an indication in Fig. 3.14 that there may be a limiting maximum
temperature for the highest thermal efficiency, and this was observed earlier by Horlock
et al. [8] and Guha [9]. It is argued by the latter and by Wilcock et al. [ 101 that this is a real
gas effect not apparent in the a/s calculations such as those shown in Fig. 3.9. This point
will be dealt with later in Chapter 4 while discussing the turbine cooling effects.
3.4.2. Comparison of several types of gas turbine plants
A set of calculations using real gas tables illustrates the performance of the several
types of gas turbine plants discussed PreViOUSlY, the [CBTIIG, [CBTX]IG, [CB~TX]IG,
[CICBTXIIG and [CICBTBTXIIG plants. Fig. 3.15 shows the overall efficiency of the five
plants, plotted against the overall pressure ratio (r) for T3 = 1200°C. These calculations
have been made with assumptions similar to those made for Figs. 3.13 and 3.14. In
addition (where applicable), equal pressure ratios are assumed in the LP and HP
turbomachinery, reheating is set to the maximum temperature and the heat exchanger
effectiveness is 0.75.
The first point to note is that the classic Hawthorne and Davis argument is reinforced-
that the optimum pressure ratio for the [CBT]IG plant (r = 45) is very much higher than
that for the [CBTXIIG plant (r = 9). (The optimum r for the latter would decrease if the
effectiveness (E) of the heat exchanger were increased, but it would increase towards that
of the [CBTIIG plant if E fell towards zero.)
While the lowest and highest optimum pressure ratios are for these two plants, the
addition of reheating and intercooling increases the optimum pressure ratios above that of