
Page 90 - Advanced Gas Turbine Cycles
P. 90
66 Advanced gas turbine cycles
54
52
50
>
0
z
0
w48
U.
U
W
j 46
d
9
044
42
40
I000 1200 1400 1600 1800 2000 2200
COMBUSTION TEMPERATURE OC
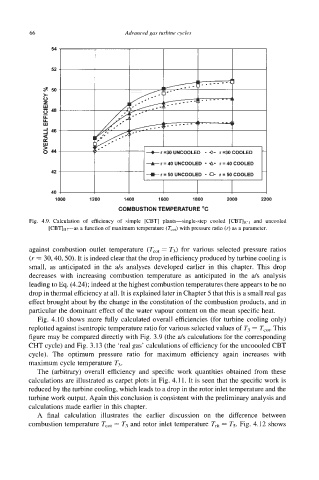
Fig. 4.9. Calculation of efficiency of simple [CBT] plants-single-step cooled [CBT],,-, and uncooled
[CBTIt-as a function of maximum temperature (Tcm) with pressure ratio (r) as a parameter.
against combustion outlet temperature (T,,, = T3) for various selected pressure ratios
(r = 30,40,50). is indeed clear that the drop in efficiency produced by turbine cooling is
It
small, as anticipated in the a/s analyses developed earlier in this chapter. This drop
decreases with increasing combustion temperature as anticipated in the a/s analysis
leading to Eq. (4.24); indeed at the highest combustion temperatures there appears to be no
drop in thermal efficiency at all. It is explained later in Chapter 5 that this is a small real gas
effect brought about by the change in the constitution of the combustion products, and in
particular the dominant effect of the water vapour content on the mean specific heat.
Fig. 4.10 shows more fully calculated overall efficiencies (for turbine cooling only)
replotted against isentropic temperature ratio for various selected values of T3 = T,,,. This
figure may be compared directly with Fig. 3.9 (the a/s calculations for the corresponding
CHT cycle) and Fig. 3.1 3 (the ‘real gas’ calculations of efficiency for the uncoooled CBT
cycle). The optimum pressure ratio for maximum efficiency again increases with
maximum cycle temperature T3.
The (arbitrary) overall efficiency and specific work quantities obtained from these
calculations are illustrated as carpet plots in Fig. 4.11. It is seen that the specific work is
reduced by the turbine cooling, which leads to a drop in the rotor inlet temperature and the
turbine work output. Again this conclusion is consistent with the preliminary analysis and
calculations made earlier in this chapter.
A final calculation illustrates the earlier discussion on the difference between
combustion temperature T,, = T3 and rotor inlet temperature T,it = Ts. Fig. 4.12 shows