Page 185 - Advanced Thermodynamics for Engineers, Second Edition
P. 185

172    CHAPTER 8 EQUATIONS OF STATE


                    250


                             7
                    200

                   Pressure, p / (bar)  150  6  4  I 3  2


                    100         II                                  1


                               5
                     50
                       0         0.005      0.010      0.015      0.020     0.025      0.030
                                                              3
                                               Specific volume, v /(m /kg)
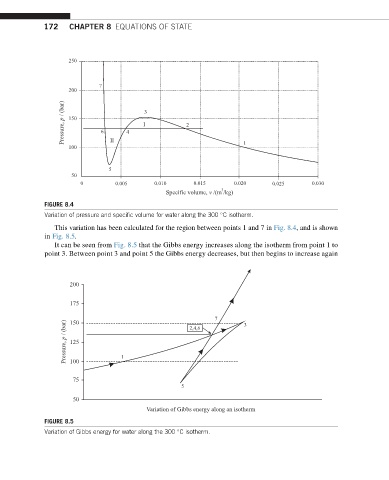
             FIGURE 8.4

             Variation of pressure and specific volume for water along the 300 C isotherm.
                This variation has been calculated for the region between points 1 and 7 in Fig. 8.4, and is shown
             in Fig. 8.5.
                It can be seen from Fig. 8.5 that the Gibbs energy increases along the isotherm from point 1 to
             point 3. Between point 3 and point 5 the Gibbs energy decreases, but then begins to increase again


                    200

                    175

                                                             7       3
                    150
                   Pressure, p / (bar)  125  1
                                                      2,4,6


                    100

                     75
                                                   5
                     50
                                          Variation of Gibbs energy along an isotherm
             FIGURE 8.5
             Variation of Gibbs energy for water along the 300 C isotherm.
   180   181   182   183   184   185   186   187   188   189   190