
Page 310 - Advanced Thermodynamics for Engineers, Second Edition
P. 310
13.5 THE EFFECT OF DISSOCIATION ON THE COMPOSITION 299
3500
3000
2500
Temperature / (K) 2000 Weak Rich
1500
1000
no dissociation
dissociation
500
0
0.5 0.6 0.7 0.8 0.9 1 1.1 1.2
Equivalence ratio, φ
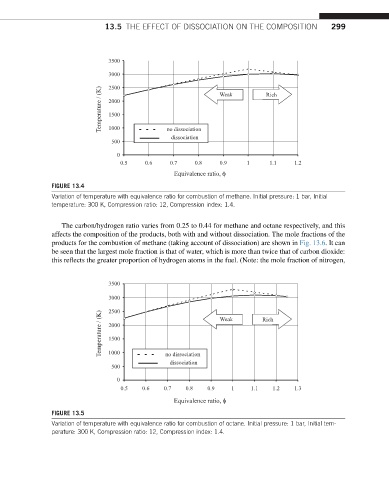
FIGURE 13.4
Variation of temperature with equivalence ratio for combustion of methane. Initial pressure: 1 bar, Initial
temperature: 300 K, Compression ratio: 12, Compression index: 1.4.
The carbon/hydrogen ratio varies from 0.25 to 0.44 for methane and octane respectively, and this
affects the composition of the products, both with and without dissociation. The mole fractions of the
products for the combustion of methane (taking account of dissociation) are shown in Fig. 13.6. It can
be seen that the largest mole fraction is that of water, which is more than twice that of carbon dioxide:
this reflects the greater proportion of hydrogen atoms in the fuel. (Note: the mole fraction of nitrogen,
3500
3500.00
3000
3000.00
2500
2500.00
Temperature / (K) 2000.00 Weak Rich
2000
1500
1500.00
1000
1000.00
no dissociation
dissociation
500
500.00
0.00 0
0.5 0.6 0.7 0.8 0.9 1 1.1 1.2 1.3
Equivalence ratio, φ
FIGURE 13.5
Variation of temperature with equivalence ratio for combustion of octane. Initial pressure: 1 bar, Initial tem-
perature: 300 K, Compression ratio: 12, Compression index: 1.4.