
Page 314 - Advanced Thermodynamics for Engineers, Second Edition
P. 314
13.7 THE FORMATION OF OXIDES OF NITROGEN 303
1.0
N 2
H O
2
0.1 CO 2
Mole fraction, x O 2 CO H 2
NO
0.01
0.001
0.6 0.8 1.0 1.2
Equivalence ratio, φ
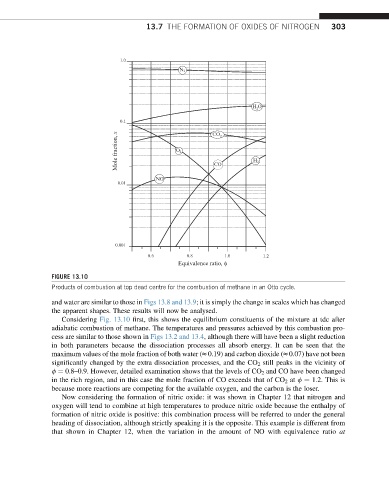
FIGURE 13.10
Products of combustion at top dead centre for the combustion of methane in an Otto cycle.
and water are similar to those in Figs 13.8 and 13.9; it is simply the change in scales which has changed
the apparent shapes. These results will now be analysed.
Considering Fig. 13.10 first, this shows the equilibrium constituents of the mixture at tdc after
adiabatic combustion of methane. The temperatures and pressures achieved by this combustion pro-
cess are similar to those shown in Figs 13.2 and 13.4, although there will have been a slight reduction
in both parameters because the dissociation processes all absorb energy. It can be seen that the
maximum values of the mole fraction of both water (z0.19) and carbon dioxide (z0.07) have not been
significantly changed by the extra dissociation processes, and the CO 2 still peaks in the vicinity of
f ¼ 0.8–0.9. However, detailed examination shows that the levels of CO 2 and CO have been changed
in the rich region, and in this case the mole fraction of CO exceeds that of CO 2 at f ¼ 1.2. This is
because more reactions are competing for the available oxygen, and the carbon is the loser.
Now considering the formation of nitric oxide: it was shown in Chapter 12 that nitrogen and
oxygen will tend to combine at high temperatures to produce nitric oxide because the enthalpy of
formation of nitric oxide is positive: this combination process will be referred to under the general
heading of dissociation, although strictly speaking it is the opposite. This example is different from
that shown in Chapter 12, when the variation in the amount of NO with equivalence ratio at