
Page 44 - Advanced thermodynamics for engineers
P. 44
2.13 EXAMPLES OF DIFFERENT FORMS OF EQUILIBRIUM MET 27
Pressure
Solid Critical point
Liquid
g g g 1
2 2
B A
E D C g Gas
1
Triple point
Temperature
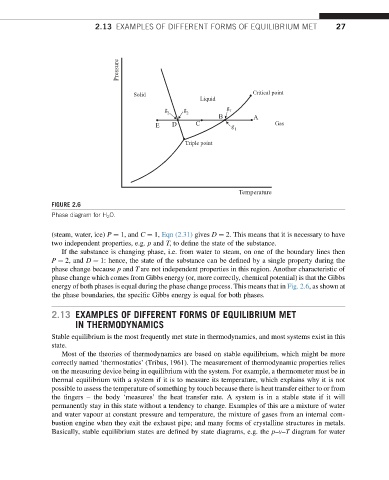
FIGURE 2.6
Phase diagram for H 2 O.
(steam, water, ice) P ¼ 1, and C ¼ 1, Eqn (2.31) gives D ¼ 2. This means that it is necessary to have
two independent properties, e.g. p and T, to define the state of the substance.
If the substance is changing phase, i.e. from water to steam, on one of the boundary lines then
P ¼ 2, and D ¼ 1: hence, the state of the substance can be defined by a single property during the
phase change because p and T are not independent properties in this region. Another characteristic of
phase change which comes from Gibbs energy (or, more correctly, chemical potential) is that the Gibbs
energy of both phases is equal during the phase change process. This means that in Fig. 2.6, as shown at
the phase boundaries, the specific Gibbs energy is equal for both phases.
2.13 EXAMPLES OF DIFFERENT FORMS OF EQUILIBRIUM MET
IN THERMODYNAMICS
Stable equilibrium is the most frequently met state in thermodynamics, and most systems exist in this
state.
Most of the theories of thermodynamics are based on stable equilibrium, which might be more
correctly named ‘thermostatics’ (Tribus, 1961). The measurement of thermodynamic properties relies
on the measuring device being in equilibrium with the system. For example, a thermometer must be in
thermal equilibrium with a system if it is to measure its temperature, which explains why it is not
possible to assess the temperature of something by touch because there is heat transfer either to or from
the fingers – the body ‘measures’ the heat transfer rate. A system is in a stable state if it will
permanently stay in this state without a tendency to change. Examples of this are a mixture of water
and water vapour at constant pressure and temperature, the mixture of gases from an internal com-
bustion engine when they exit the exhaust pipe; and many forms of crystalline structures in metals.
Basically, stable equilibrium states are defined by state diagrams, e.g. the p–v–T diagram for water