
Page 150 - Advanced Mine Ventilation
P. 150
130 Advanced Mine Ventilation
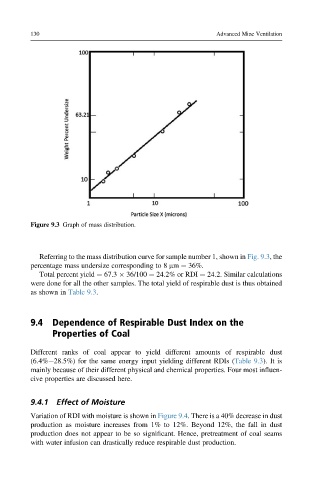
Figure 9.3 Graph of mass distribution.
Referring to the mass distribution curve for sample number 1, shown in Fig. 9.3, the
percentage mass undersize corresponding to 8 mm ¼ 36%.
Total percent yield ¼ 67.3 36/100 ¼ 24.2% or RDI ¼ 24.2. Similar calculations
were done for all the other samples. The total yield of respirable dust is thus obtained
as shown in Table 9.3.
9.4 Dependence of Respirable Dust Index on the
Properties of Coal
Different ranks of coal appear to yield different amounts of respirable dust
(6.4%e28.5%) for the same energy input yielding different RDIs (Table 9.3). It is
mainly because of their different physical and chemical properties. Four most influen-
cive properties are discussed here.
9.4.1 Effect of Moisture
Variation of RDI with moisture is shown in Figure 9.4. There is a 40% decrease in dust
production as moisture increases from 1% to 12%. Beyond 12%, the fall in dust
production does not appear to be so significant. Hence, pretreatment of coal seams
with water infusion can drastically reduce respirable dust production.