
Page 142 - Advances In Productive, Safe, and Responsible Coal Mining
P. 142
126 Advances in Productive, Safe, and Responsible Coal Mining
After calculation of signal levels and variations at a location are completed, the
manufacturer’s tracking algorithm is applied to signal strengths appearing at half-
pillar and intersection locations to generate calculated position estimates. These posi-
tion estimates are then used to determine estimated values of tracking system metrics.
In the five illustrations that follow (Figs. 8.3–8.7), two examples showing plots of
250 TSP around the GTP for which they were simulated are provided. For the first
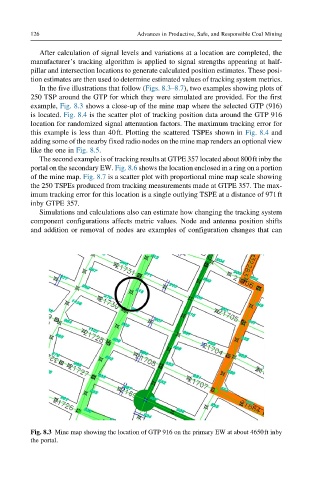
example, Fig. 8.3 shows a close-up of the mine map where the selected GTP (916)
is located. Fig. 8.4 is the scatter plot of tracking position data around the GTP 916
location for randomized signal attenuation factors. The maximum tracking error for
this example is less than 40ft. Plotting the scattered TSPEs shown in Fig. 8.4 and
adding some of the nearby fixed radio nodes on the mine map renders an optional view
like the one in Fig. 8.5.
The second example is of tracking results at GTPE 357 located about 800ft inby the
portal on the secondary EW. Fig. 8.6 shows the location enclosed in a ring on a portion
of the mine map. Fig. 8.7 is a scatter plot with proportional mine map scale showing
the 250 TSPEs produced from tracking measurements made at GTPE 357. The max-
imum tracking error for this location is a single outlying TSPE at a distance of 971ft
inby GTPE 357.
Simulations and calculations also can estimate how changing the tracking system
component configurations affects metric values. Node and antenna position shifts
and addition or removal of nodes are examples of configuration changes that can
Fig. 8.3 Mine map showing the location of GTP 916 on the primary EW at about 4650ft inby
the portal.