
Page 166 - Advances In Productive, Safe, and Responsible Coal Mining
P. 166
148 Advances in Productive, Safe, and Responsible Coal Mining
15ft of an anchor point was selected from data sets to be used. For each of these GTPs,
there is an associated time it was recorded. Also with this time is a set of handsets that
were located on the buggy. For each time and handset, TSP values are queried from the
tracking database. This method of comparing may cause inconsistency with metric
values reported for the simulation-only data earlier in this chapter; however, for
the purposes of comparison, data comparing measured and predicted results will only
include data points that meet the criteria described here.
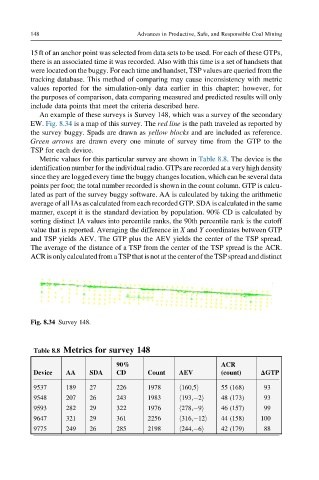
An example of these surveys is Survey 148, which was a survey of the secondary
EW. Fig. 8.34 is a map of this survey. The red line is the path traveled as reported by
the survey buggy. Spads are drawn as yellow blocks and are included as reference.
Green arrows are drawn every one minute of survey time from the GTP to the
TSP for each device.
Metric values for this particular survey are shown in Table 8.8. The device is the
identification number for the individual radio. GTPs are recorded at a very high density
since they are logged every time the buggy changes location, which can be several data
points per foot; the total number recorded is shown in the count column. GTP is calcu-
lated as part of the survey buggy software. AA is calculated by taking the arithmetic
average of all IAs as calculated from each recorded GTP. SDA is calculated in the same
manner, except it is the standard deviation by population. 90% CD is calculated by
sorting distinct IA values into percentile ranks, the 90th percentile rank is the cutoff
value that is reported. Averaging the difference in X and Y coordinates between GTP
and TSP yields AEV. The GTP plus the AEV yields the center of the TSP spread.
The average of the distance of a TSP from the center of the TSP spread is the ACR.
ACR isonly calculated from a TSPthat is notat thecenter of theTSP spread and distinct
Fig. 8.34 Survey 148.
Table 8.8 Metrics for survey 148
90% ACR
Device AA SDA CD Count AEV (count) ΔGTP
9537 189 27 226 1978 h160,5i 55 (168) 93
9548 207 26 243 1983 h193, 2i 48 (173) 93
9593 282 29 322 1976 h278, 9i 46 (157) 99
9647 321 29 361 2256 h316, 12i 44 (158) 100
9775 249 26 285 2198 h244, 6i 42 (179) 88