
Page 167 - Advances In Productive, Safe, and Responsible Coal Mining
P. 167
Communication and tracking system performance 149
values to avoid weighting. The count of TSPs used in the ACR is shown in parentheses.
This is generally the number of times the tracking system calculated a location during
the survey. Delta GTP is the straight-line distance from minimum GTP to maximum
GTP. It is not the distance the survey buggy traveled, rather it is the diagonal distance
oftheboundingboxarea.Forexample,thebuggycouldbeusedtocovera5-ftarea 1000
times for a distance traveled of 5000ft, but a Delta GTP of only 5.
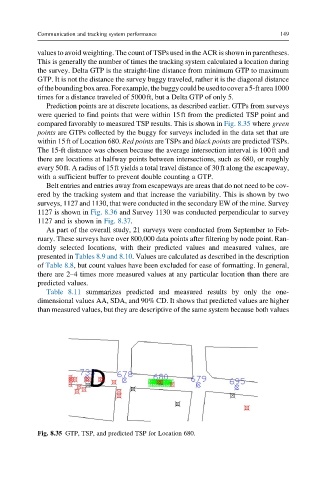
Prediction points are at discrete locations, as described earlier. GTPs from surveys
were queried to find points that were within 15ft from the predicted TSP point and
compared favorably to measured TSP results. This is shown in Fig. 8.35 where green
points are GTPs collected by the buggy for surveys included in the data set that are
within 15ft of Location 680. Red points are TSPs and black points are predicted TSPs.
The 15-ft distance was chosen because the average intersection interval is 100ft and
there are locations at halfway points between intersections, such as 680, or roughly
every 50ft. A radius of 15ft yields a total travel distance of 30ft along the escapeway,
with a sufficient buffer to prevent double counting a GTP.
Belt entries and entries away from escapeways are areas that do not need to be cov-
ered by the tracking system and that increase the variability. This is shown by two
surveys, 1127 and 1130, that were conducted in the secondary EW of the mine. Survey
1127 is shown in Fig. 8.36 and Survey 1130 was conducted perpendicular to survey
1127 and is shown in Fig. 8.37.
As part of the overall study, 21 surveys were conducted from September to Feb-
ruary. These surveys have over 800,000 data points after filtering by node point. Ran-
domly selected locations, with their predicted values and measured values, are
presented in Tables 8.9 and 8.10. Values are calculated as described in the description
of Table 8.8, but count values have been excluded for ease of formatting. In general,
there are 2–4 times more measured values at any particular location than there are
predicted values.
Table 8.11 summarizes predicted and measured results by only the one-
dimensional values AA, SDA, and 90% CD. It shows that predicted values are higher
than measured values, but they are descriptive of the same system because both values
Fig. 8.35 GTP, TSP, and predicted TSP for Location 680.