
Page 274 - Advances In Productive, Safe, and Responsible Coal Mining
P. 274
Sustainable coal waste disposal practices 253
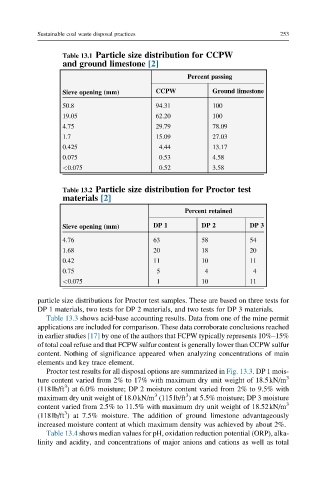
Table 13.1 Particle size distribution for CCPW
and ground limestone [2]
Percent passing
Sieve opening (mm) CCPW Ground limestone
50.8 94.31 100
19.05 62.20 100
4.75 29.79 78.09
1.7 15.09 27.03
0.425 4.44 13.17
0.075 0.53 4.58
<0.075 0.52 3.58
Table 13.2 Particle size distribution for Proctor test
materials [2]
Percent retained
Sieve opening (mm) DP 1 DP 2 DP 3
4.76 63 58 54
1.68 20 18 20
0.42 11 10 11
0.75 5 4 4
<0.075 1 10 11
particle size distributions for Proctor test samples. These are based on three tests for
DP 1 materials, two tests for DP 2 materials, and two tests for DP 3 materials.
Table 13.3 shows acid-base accounting results. Data from one of the mine permit
applications are included for comparison. These data corroborate conclusions reached
in earlier studies [17] by one of the authors that FCPW typically represents 10%–15%
of total coal refuse and that FCPW sulfur content is generally lower than CCPW sulfur
content. Nothing of significance appeared when analyzing concentrations of main
elements and key trace element.
Proctor test results for all disposal options are summarized in Fig. 13.3. DP 1 mois-
3
ture content varied from 2% to 17% with maximum dry unit weight of 18.5kN/m
3
(118lb/ft ) at 6.0% moisture; DP 2 moisture content varied from 2% to 9.5% with
3
3
maximum dry unit weight of 18.0kN/m (115lb/ft ) at 5.5% moisture; DP 3 moisture
content varied from 2.5% to 11.5% with maximum dry unit weight of 18.52kN/m 3
3
(118lb/ft ) at 7.5% moisture. The addition of ground limestone advantageously
increased moisture content at which maximum density was achieved by about 2%.
Table 13.4 shows median values for pH, oxidation reduction potential (ORP), alka-
linity and acidity, and concentrations of major anions and cations as well as total