
Page 277 - Advances In Productive, Safe, and Responsible Coal Mining
P. 277
Sustainable coal waste disposal practices 255
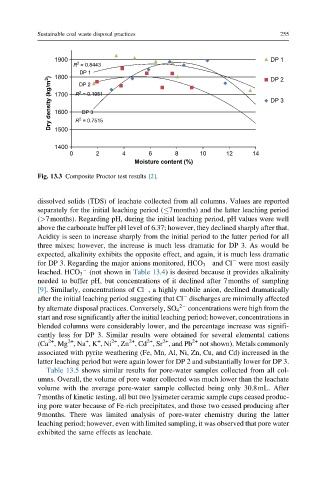
1900 DP 1
2
R = 0.8443
DP 1 DP 2
1800
Dry density (kg/m 3 ) 1700 R = 0.1951 DP 3
DP 2
2
1600
DP 3
2
R = 0.7515
1500
1400
0 2 4 6 8 10 12 14
Moisture content (%)
Fig. 13.3 Composite Proctor test results [2].
dissolved solids (TDS) of leachate collected from all columns. Values are reported
separately for the initial leaching period ( 7months) and the latter leaching period
(>7months). Regarding pH, during the initial leaching period, pH values were well
above the carbonate buffer pH level of 6.37; however, they declined sharply after that.
Acidity is seen to increase sharply from the initial period to the latter period for all
three mixes; however, the increase is much less dramatic for DP 3. As would be
expected, alkalinity exhibits the opposite effect, and again, it is much less dramatic
for DP 3. Regarding the major anions monitored, HCO 3 and Cl were most easily
leached. HCO 3 (not shown in Table 13.4) is desired because it provides alkalinity
needed to buffer pH, but concentrations of it declined after 7months of sampling
[9]. Similarly, concentrations of Cl , a highly mobile anion, declined dramatically
after the initial leaching period suggesting that Cl discharges are minimally affected
2
by alternate disposal practices. Conversely, SO 4 concentrations were high from the
start and rose significantly after the initial leaching period; however, concentrations in
blended columns were considerably lower, and the percentage increase was signifi-
cantly less for DP 3. Similar results were obtained for several elemental cations
2+
2+
2+
+
+
2+
2+
2+
(Ca ,Mg ,Na ,K ,Ni ,Zn ,Cd ,Sr , and Pb 2+ not shown). Metals commonly
associated with pyrite weathering (Fe, Mn, Al, Ni, Zn, Cu, and Cd) increased in the
latter leaching period but were again lower for DP 2 and substantially lower for DP 3.
Table 13.5 shows similar results for pore-water samples collected from all col-
umns. Overall, the volume of pore water collected was much lower than the leachate
volume with the average pore-water sample collected being only 30.8mL. After
7months of kinetic testing, all but two lysimeter ceramic sample cups ceased produc-
ing pore water because of Fe-rich precipitates, and those two ceased producing after
9months. There was limited analysis of pore-water chemistry during the latter
leaching period; however, even with limited sampling, it was observed that pore water
exhibited the same effects as leachate.