
Page 282 - Advances In Productive, Safe, and Responsible Coal Mining
P. 282
258 Advances in Productive, Safe, and Responsible Coal Mining
2
The decline in HCO 3 concentrations was much greater than for SO 4 concentra-
tions in both codisposal columns suggesting that carbonate weathering rates are faster
than pyrite weathering rates in the coal refuse environment or that alkalinity-
producing minerals are being coated with mineral precipitates that are limiting disso-
2
lution. SO 4 mobility was significantly lower in codisposal columns, especially with
limestone addition. The higher extraction of S compared with Ca suggests that the
2
formation of calcium SO 4 such as gypsum or anhydrite was relatively small. Ele-
ments associated with alkalinity-producing minerals (e.g., calcite and dolomite) such
as Ca, Mg, and Sr were leached to a greater extent than heavy metals typically asso-
ciated with pyrite such as Mn, N, and Zn and lithophile elements such as Al and K.
Data for elemental constituents were converted to a mass (loading) basis by mul-
tiplying concentration values and leachate volume allowing the determination of
cumulative elemental extraction. Mass data were plotted as a function of time, with
time represented by leach cycles. The complete kinetic testing program consisted of
16 leach cycles comprising 568days with an average of 19,813mL of leachate col-
lected from all of the columns for each cycle. Leachate volume was then compared
with estimated pore volume of 54,501mL to yield an initial liquid-to-solid (L/S) ratio
of 0.19. As a result, the average rate of pore volume flushing is approximately 0.36
volumes per leach cycle with 5.82 pore volumes leached over the course of the study.
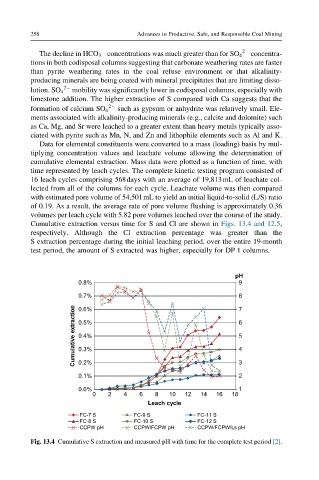
Cumulative extraction versus time for S and Cl are shown in Figs. 13.4 and 12.5,
respectively. Although the Cl extraction percentage was greater than the
S extraction percentage during the initial leaching period, over the entire 19-month
test period, the amount of S extracted was higher, especially for DP 1 columns.
pH
0.8% 9
0.7% 8 7
Cumulative extraction 0.5% 6 5 4
0.6%
0.4%
0.3%
0.2%
0.1% 3 2
0.0% 1
0 2 4 6 8 10 12 14 16 18
Leach cycle
FC-7 S FC-9 S FC-11 S
FC-8 S FC-10 S FC-12 S
CCPW pH CCPW/FCPW pH CCPW/FCPW/Ls pH
Fig. 13.4 Cumulative S extraction and measured pH with time for the complete test period [2].