
Page 34 - Advances In Productive, Safe, and Responsible Coal Mining
P. 34
20 Advances in Productive, Safe, and Responsible Coal Mining
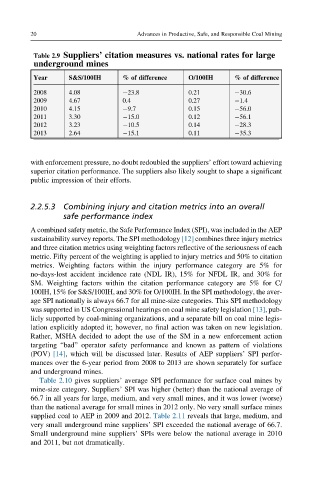
Table 2.9 Suppliers’ citation measures vs. national rates for large
underground mines
Year S&S/100IH % of difference O/100IH % of difference
2008 4.08 23.8 0.21 30.6
2009 4.67 0.4 0.27 1.4
2010 4.15 9.7 0.15 56.0
2011 3.30 15.0 0.12 56.1
2012 3.23 10.5 0.14 28.3
2013 2.64 15.1 0.11 35.3
with enforcement pressure, no doubt redoubled the suppliers’ effort toward achieving
superior citation performance. The suppliers also likely sought to shape a significant
public impression of their efforts.
2.2.5.3 Combining injury and citation metrics into an overall
safe performance index
A combined safety metric, the Safe Performance Index (SPI), was included in the AEP
sustainability survey reports. The SPI methodology [12] combines three injury metrics
and three citation metrics using weighting factors reflective of the seriousness of each
metric. Fifty percent of the weighting is applied to injury metrics and 50% to citation
metrics. Weighting factors within the injury performance category are 5% for
no-days-lost accident incidence rate (NDL IR), 15% for NFDL IR, and 30% for
SM. Weighting factors within the citation performance category are 5% for C/
100IH, 15% for S&S/100IH, and 30% for O/100IH. In the SPI methodology, the aver-
age SPI nationally is always 66.7 for all mine-size categories. This SPI methodology
was supported in US Congressional hearings on coal mine safety legislation [13], pub-
licly supported by coal-mining organizations, and a separate bill on coal mine legis-
lation explicitly adopted it; however, no final action was taken on new legislation.
Rather, MSHA decided to adopt the use of the SM in a new enforcement action
targeting “bad” operator safety performance and known as pattern of violations
(POV) [14], which will be discussed later. Results of AEP suppliers’ SPI perfor-
mances over the 6-year period from 2008 to 2013 are shown separately for surface
and underground mines.
Table 2.10 gives suppliers’ average SPI performance for surface coal mines by
mine-size category. Suppliers’ SPI was higher (better) than the national average of
66.7 in all years for large, medium, and very small mines, and it was lower (worse)
than the national average for small mines in 2012 only. No very small surface mines
supplied coal to AEP in 2009 and 2012. Table 2.11 reveals that large, medium, and
very small underground mine suppliers’ SPI exceeded the national average of 66.7.
Small underground mine suppliers’ SPIs were below the national average in 2010
and 2011, but not dramatically.