
Page 30 - Advances In Productive, Safe, and Responsible Coal Mining
P. 30
16 Advances in Productive, Safe, and Responsible Coal Mining
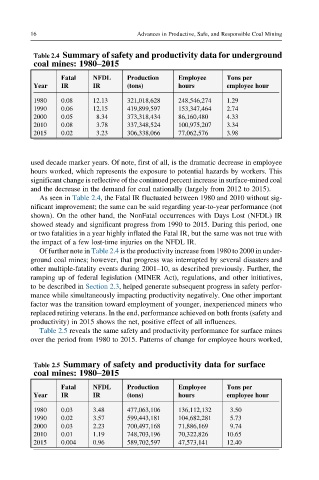
Table 2.4 Summary of safety and productivity data for underground
coal mines: 1980–2015
Fatal NFDL Production Employee Tons per
Year IR IR (tons) hours employee hour
1980 0.08 12.13 321,018,628 248,546,274 1.29
1990 0.06 12.15 419,899,597 153,347,464 2.74
2000 0.05 8.34 373,318,434 86,160,480 4.33
2010 0.08 3.78 337,348,524 100,975,207 3.34
2015 0.02 3.23 306,338,066 77,062,576 3.98
used decade marker years. Of note, first of all, is the dramatic decrease in employee
hours worked, which represents the exposure to potential hazards by workers. This
significant change is reflective of the continued percent increase in surface-mined coal
and the decrease in the demand for coal nationally (largely from 2012 to 2015).
As seen in Table 2.4, the Fatal IR fluctuated between 1980 and 2010 without sig-
nificant improvement; the same can be said regarding year-to-year performance (not
shown). On the other hand, the NonFatal occurrences with Days Lost (NFDL) IR
showed steady and significant progress from 1990 to 2015. During this period, one
or two fatalities in a year highly inflated the Fatal IR, but the same was not true with
the impact of a few lost-time injuries on the NFDL IR.
Of further note in Table 2.4 is the productivity increase from 1980 to 2000 in under-
ground coal mines; however, that progress was interrupted by several disasters and
other multiple-fatality events during 2001–10, as described previously. Further, the
ramping up of federal legislation (MINER Act), regulations, and other initiatives,
to be described in Section 2.3, helped generate subsequent progress in safety perfor-
mance while simultaneously impacting productivity negatively. One other important
factor was the transition toward employment of younger, inexperienced miners who
replaced retiring veterans. In the end, performance achieved on both fronts (safety and
productivity) in 2015 shows the net, positive effect of all influences.
Table 2.5 reveals the same safety and productivity performance for surface mines
over the period from 1980 to 2015. Patterns of change for employee hours worked,
Table 2.5 Summary of safety and productivity data for surface
coal mines: 1980–2015
Fatal NFDL Production Employee Tons per
Year IR IR (tons) hours employee hour
1980 0.03 3.48 477,063,106 136,112,132 3.50
1990 0.02 3.57 599,443,181 104,682,281 5.73
2000 0.03 2.23 700,497,168 71,886,169 9.74
2010 0.01 1.19 748,703,196 70,322,826 10.65
2015 0.004 0.96 589,702,597 47,573,141 12.40