
Page 29 - Advances In Productive, Safe, and Responsible Coal Mining
P. 29
Safety and productivity in coal mining—How to make both the top priority 15
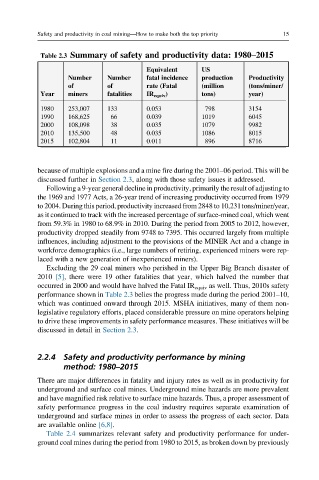
Table 2.3 Summary of safety and productivity data: 1980–2015
Equivalent US
Number Number fatal incidence production Productivity
of of rate (Fatal (million (tons/miner/
Year miners fatalities IR equiv ) tons) year)
1980 253,007 133 0.053 798 3154
1990 168,625 66 0.039 1019 6045
2000 108,098 38 0.035 1079 9982
2010 135,500 48 0.035 1086 8015
2015 102,804 11 0.011 896 8716
because of multiple explosions and a mine fire during the 2001–06 period. This will be
discussed further in Section 2.3, along with those safety issues it addressed.
Following a 9-year general decline in productivity, primarily the result of adjusting to
the 1969 and 1977 Acts, a 26-year trend of increasing productivity occurred from 1979
to 2004. During this period, productivity increased from 2848 to 10,231tons/miner/year,
as it continued to track with the increased percentage of surface-mined coal, which went
from 59.3% in 1980 to 68.9% in 2010. During the period from 2005 to 2012, however,
productivity dropped steadily from 9748 to 7395. This occurred largely from multiple
influences, including adjustment to the provisions of the MINER Act and a change in
workforce demographics (i.e., large numbers of retiring, experienced miners were rep-
laced with a new generation of inexperienced miners).
Excluding the 29 coal miners who perished in the Upper Big Branch disaster of
2010 [5], there were 19 other fatalities that year, which halved the number that
occurred in 2000 and would have halved the Fatal IR equiv as well. Thus, 2010s safety
performance shown in Table 2.3 belies the progress made during the period 2001–10,
which was continued onward through 2015. MSHA initiatives, many of them non-
legislative regulatory efforts, placed considerable pressure on mine operators helping
to drive these improvements in safety performance measures. These initiatives will be
discussed in detail in Section 2.3.
2.2.4 Safety and productivity performance by mining
method: 1980–2015
There are major differences in fatality and injury rates as well as in productivity for
underground and surface coal mines. Underground mine hazards are more prevalent
and have magnified risk relative to surface mine hazards. Thus, a proper assessment of
safety performance progress in the coal industry requires separate examination of
underground and surface mines in order to assess the progress of each sector. Data
are available online [6,8].
Table 2.4 summarizes relevant safety and productivity performance for under-
ground coal mines during the period from 1980 to 2015, as broken down by previously