
Page 32 - Advances In Productive, Safe, and Responsible Coal Mining
P. 32
18 Advances in Productive, Safe, and Responsible Coal Mining
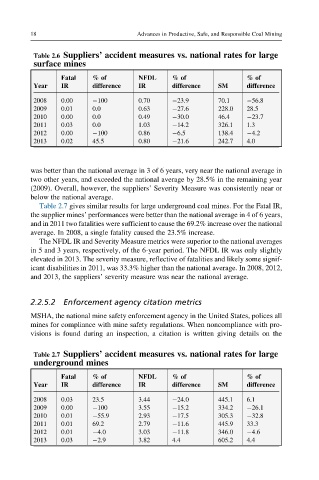
Table 2.6 Suppliers’ accident measures vs. national rates for large
surface mines
Fatal %of NFDL %of %of
Year IR difference IR difference SM difference
2008 0.00 100 0.70 23.9 70.1 56.8
2009 0.01 0.0 0.63 27.6 228.0 28.5
2010 0.00 0.0 0.49 30.0 46.4 23.7
2011 0.03 0.0 1.03 14.2 326.1 1.3
2012 0.00 100 0.86 6.5 138.4 4.2
2013 0.02 45.5 0.80 21.6 242.7 4.0
was better than the national average in 3 of 6 years, very near the national average in
two other years, and exceeded the national average by 28.5% in the remaining year
(2009). Overall, however, the suppliers’ Severity Measure was consistently near or
below the national average.
Table 2.7 gives similar results for large underground coal mines. For the Fatal IR,
the supplier mines’ performances were better than the national average in 4 of 6 years,
and in 2011 two fatalities were sufficient to cause the 69.2% increase over the national
average. In 2008, a single fatality caused the 23.5% increase.
The NFDL IR and Severity Measure metrics were superior to the national averages
in 5 and 3 years, respectively, of the 6-year period. The NFDL IR was only slightly
elevated in 2013. The severity measure, reflective of fatalities and likely some signif-
icant disabilities in 2011, was 33.3% higher than the national average. In 2008, 2012,
and 2013, the suppliers’ severity measure was near the national average.
2.2.5.2 Enforcement agency citation metrics
MSHA, the national mine safety enforcement agency in the United States, polices all
mines for compliance with mine safety regulations. When noncompliance with pro-
visions is found during an inspection, a citation is written giving details on the
Table 2.7 Suppliers’ accident measures vs. national rates for large
underground mines
Fatal %of NFDL %of %of
Year IR difference IR difference SM difference
2008 0.03 23.5 3.44 24.0 445.1 6.1
2009 0.00 100 3.55 15.2 334.2 26.1
2010 0.01 55.9 2.93 17.5 305.3 32.8
2011 0.01 69.2 2.79 11.6 445.9 33.3
2012 0.01 4.0 3.03 11.8 346.0 4.6
2013 0.03 2.9 3.82 4.4 605.2 4.4