
Page 84 - Advances In Productive, Safe, and Responsible Coal Mining
P. 84
70 Advances in Productive, Safe, and Responsible Coal Mining
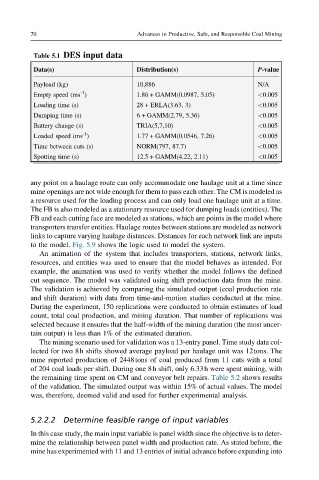
Table 5.1 DES input data
Data(s) Distribution(s) P-value
Payload (kg) 10,886 N/A
-1
Empty speed (ms ) 1.86 + GAMM(0.0987, 5.05) <0.005
Loading time (s) 28 + ERLA(3.63, 3) <0.005
Dumping time (s) 6 + GAMM(2.79, 5.36) <0.005
Battery change (s) TRIA(5,7,10) <0.005
-1
Loaded speed (ms ) 1.77 + GAMM(0.0546, 7.26) <0.005
Time between cuts (s) NORM(797, 87.7) <0.005
Spotting time (s) 12.5 + GAMM(4.22, 2.11) <0.005
any point on a haulage route can only accommodate one haulage unit at a time since
mine openings are not wide enough for them to pass each other. The CM is modeled as
a resource used for the loading process and can only load one haulage unit at a time.
The FB is also modeled as a stationary resource used for dumping loads (entities). The
FB and each cutting face are modeled as stations, which are points in the model where
transporters transfer entities. Haulage routes between stations are modeled as network
links to capture varying haulage distances. Distances for each network link are inputs
to the model. Fig. 5.9 shows the logic used to model the system.
An animation of the system that includes transporters, stations, network links,
resources, and entities was used to ensure that the model behaves as intended. For
example, the animation was used to verify whether the model follows the defined
cut sequence. The model was validated using shift production data from the mine.
The validation is achieved by comparing the simulated output (coal production rate
and shift duration) with data from time-and-motion studies conducted at the mine.
During the experiment, 150 replications were conducted to obtain estimates of load
count, total coal production, and mining duration. That number of replications was
selected because it ensures that the half-width of the mining duration (the most uncer-
tain output) is less than 1% of the estimated duration.
The mining scenario used for validation was a 13-entry panel. Time study data col-
lected for two 8h shifts showed average payload per haulage unit was 12tons. The
mine reported production of 2448tons of coal produced from 11 cuts with a total
of 204 coal loads per shift. During one 8h shift, only 6.33h were spent mining, with
the remaining time spent on CM and conveyor belt repairs. Table 5.2 shows results
of the validation. The simulated output was within 15% of actual values. The model
was, therefore, deemed valid and used for further experimental analysis.
5.2.2.2 Determine feasible range of input variables
In this case study, the main input variable is panel width since the objective is to deter-
mine the relationship between panel width and production rate. As stated before, the
mine has experimented with 11 and 13 entries of initial advance before expanding into