
Page 87 - Advances In Productive, Safe, and Responsible Coal Mining
P. 87
72 Advances in Productive, Safe, and Responsible Coal Mining
Table 5.2 Results of DES validation experiment
Parameter Actual Simulated Difference
Duration of mining (h) 6.33 6.83 8%
Production (tons) 2448 2748 12%
Number of haulage units loads 204 226 11%
Half-width of duration (h) N/A 0.012 N/A
rooms if necessary. This means that for panel widths greater than 13 entries, there are
two cut sequences: one where the central 11 or 13 entries are mined first before rooms
are mined. Once the initial advance is mined, the mine has mined anywhere from zero
to five additional rooms on each side depending on the designed width of the panel.
For this case study, however, only cut sequences where the central 11 entries are
mined first before rooms are mined were considered to generate the relationship
between production rate and panel width. This is because previous research at the
same mine indicated that cut sequences with 11 central entries lead to higher produc-
tion rates than those with 13 central entries [1].
In this previous research, it was determined that assigning four haulage units to the
CM is optimal for panel widths being considered and for operating conditions at the
mine [1]. Hence, four haulage units are assigned to the CM in presenting the case study
in this chapter.
5.2.2.3 Estimate production rates
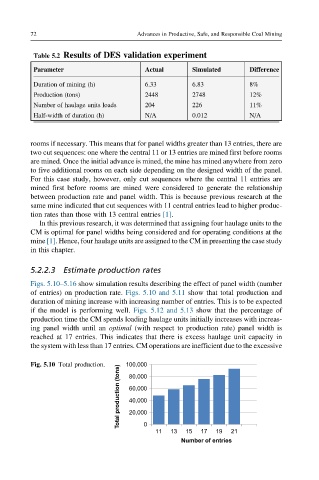
Figs. 5.10–5.16 show simulation results describing the effect of panel width (number
of entries) on production rate. Figs. 5.10 and 5.11 show that total production and
duration of mining increase with increasing number of entries. This is to be expected
if the model is performing well. Figs. 5.12 and 5.13 show that the percentage of
production time the CM spends loading haulage units initially increases with increas-
ing panel width until an optimal (with respect to production rate) panel width is
reached at 17 entries. This indicates that there is excess haulage unit capacity in
the system with less than 17 entries. CM operations are inefficient due to the excessive
Fig. 5.10 Total production. 100,000
Total production (tons) 60,000
80,000
40,000
20,000
0
11 13 15 17 19 21
Number of entries