
Page 32 - Advances in Biomechanics and Tissue Regeneration
P. 32
26 2. BIOMECHANICS OF THE VESTIBULAR SYSTEM: A NUMERICAL SIMULATION
validate the model, three distinct particle discretization meshes were considered and analyzed, named as follows:
Mesh1 (1790 particles), Mesh2 (7410 particles), and Mesh3 (13,637 particles).
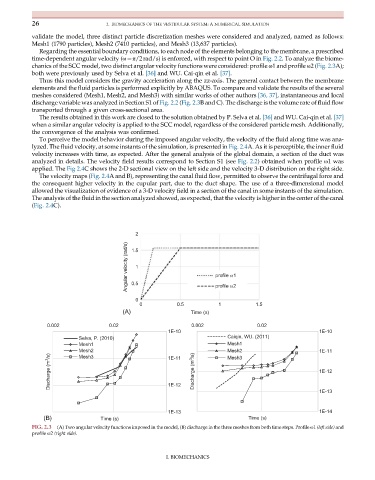
Regarding the essential boundary conditions, to each node of the elements belonging to the membrane, a prescribed
time-dependent angular velocity (ω¼π/2rad/s) is enforced, with respect to point O in Fig. 2.2. To analyze the biome-
chanics of the SCC model, two distinct angular velocity functions were considered: profile ω1 and profile ω2(Fig. 2.3A);
both were previously used by Selva et al. [36] and WU. Cai-qin et al. [37].
Thus this model considers the gravity acceleration along the zz-axis. The general contact between the membrane
elements and the fluid particles is performed explicitly by ABAQUS. To compare and validate the results of the several
meshes considered (Mesh1, Mesh2, and Mesh3) with similar works of other authors [36, 37], instantaneous and local
discharge variable was analyzed in Section S1 of Fig. 2.2 (Fig. 2.3B and C). The discharge is the volume rate of fluid flow
transported through a given cross-sectional area.
The results obtained in this work are closed to the solution obtained by P. Selva et al. [36] and WU. Cai-qin et al. [37]
when a similar angular velocity is applied to the SCC model, regardless of the considered particle mesh. Additionally,
the convergence of the analysis was confirmed.
To perceive the model behavior during the imposed angular velocity, the velocity of the fluid along time was ana-
lyzed. The fluid velocity, at some instants of the simulation, is presented in Fig. 2.4A. As it is perceptible, the inner fluid
velocity increases with time, as expected. After the general analysis of the global domain, a section of the duct was
analyzed in details. The velocity field results correspond to Section S1 (see Fig. 2.2) obtained when profile ω1 was
applied. The Fig 2.4C shows the 2-D sectional view on the left side and the velocity 3-D distribution on the right side.
The velocity maps (Fig. 2.4A and B), representing the canal fluid flow, permitted to observe the centrifugal force and
the consequent higher velocity in the cupular part, due to the duct shape. The use of a three-dimensional model
allowed the visualization of evidence of a 3-D velocity field in a section of the canal in some instants of the simulation.
The analysis of the fluid in the section analyzed showed, as expected, that the velocity is higher in the center of the canal
(Fig. 2.4C).
2
Angular velocity (rad/s) 1.5 1 profile w1
0.5
0 profile w2
0 0.5 1 1.5
(A) Time (s)
0.002 0.02 0.002 0.02
1E-10 1E-10
Selva, P. (2010) Caiqin, WU. (2011)
Mesh1 Mesh1
Mesh2 1E-11 Mesh2 1E-11
Discharge (m 3 /s) Discharge (m 3 /s) 1E-12
Mesh3
Mesh3
1E-12
1E-13
1E-13 1E-14
(B) Time (s) Time (s)
FIG. 2.3 (A) Two angular velocity functions imposed in the model, (B) discharge in the three meshes from both time steps. Profile ω1 (left side) and
profile ω2 (right side).
I. BIOMECHANICS