
Page 335 - Advances in Biomechanics and Tissue Regeneration
P. 335
16.6 SOME APPLICATIONS OF INTEREST 333
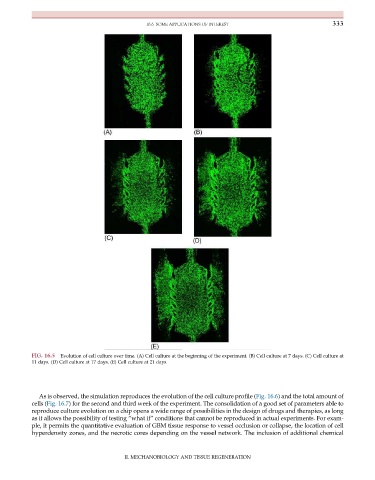
FIG. 16.5 Evolution of cell culture over time. (A) Cell culture at the beginning of the experiment. (B) Cell culture at 7 days. (C) Cell culture at
11 days. (D) Cell culture at 17 days. (E) Cell culture at 21 days.
As is observed, the simulation reproduces the evolution of the cell culture profile (Fig. 16.6) and the total amount of
cells (Fig. 16.7) for the second and third week of the experiment. The consolidation of a good set of parameters able to
reproduce culture evolution on a chip opens a wide range of possibilities in the design of drugs and therapies, as long
as it allows the possibility of testing “what if” conditions that cannot be reproduced in actual experiments. For exam-
ple, it permits the quantitative evaluation of GBM tissue response to vessel occlusion or collapse, the location of cell
hyperdensity zones, and the necrotic cores depending on the vessel network. The inclusion of additional chemical
II. MECHANOBIOLOGY AND TISSUE REGENERATION