
Page 338 - Advances in Biomechanics and Tissue Regeneration
P. 338
336 16. ON THE SIMULATION OF ORGAN-ON-CHIP CELL PROCESSES
16.6.2.1 Model and Parameters
Equations of the model are the following:
∂C n 2 1 C n 1
¼ D n — C n χ— ðC n —O 2 Þ + 1 S nd ðO 2 ÞC n
∂t τ n C sat τ d
∂C n 1
S nd ðO 2 ÞC n
∂t τ d
¼
∂O 2 2 O 2 (16.111)
¼ D O 2 — O 2 α K C n
∂t O 2 + O
2
Here, D n is the diffusion coefficient of the normoxic phenotype, χ is the chemotaxis coefficient, τ n and τ d are the growth
K
and death characteristic times, C sat is the cell capacity, α is the oxygen consumption, and O is the Michaelis-Menten
2
constant of cellular respiration kinetics. The function S nd (O 2 ) is a step function that takes into account oxygen concen-
d
d
tration, that is S nd ¼ 1 when O 2 O and S nd ¼ 0 when O 2 > O .In Table 16.2, the values of the parameters selected for
2 2
the illustrative simulation are listed.
16.6.2.2 Geometry
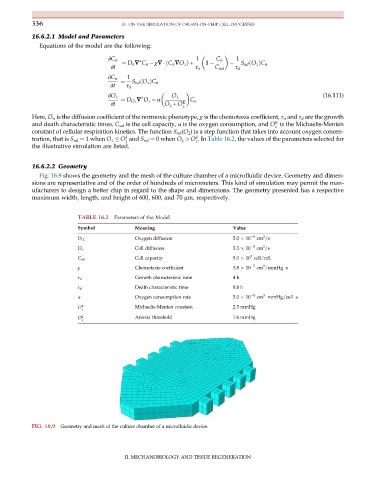
Fig. 16.9 shows the geometry and the mesh of the culture chamber of a microfluidic device. Geometry and dimen-
sions are representative and of the order of hundreds of micrometers. This kind of simulation may permit the man-
ufacturers to design a better chip in regard to the shape and dimensions. The geometry presented has a respective
maximum width, length, and height of 600, 600, and 70 μm, respectively.
TABLE 16.2 Parameters of the Model
Symbol Meaning Value
2
Oxygen diffusion 5.0 10 5 cm /s
D O 2
2
D n Cell diffusion 3.3 10 6 cm /s
7
C sat Cell capacity 5.0 10 cell/mL
2
χ Chemotaxis coefficient 3.8 10 5 cm /mmHg s
τ n Growth characteristic time 4 h
Death characteristic time 0.8 h
τ d
3
α Oxygen consumption rate 5.0 10 8 cm mmHg/cell s
O K 2 Michaelis-Menten constant 2.5 mmHg
O d 2 Anoxia threshold 1.6 mmHg
FIG. 16.9 Geometry and mesh of the culture chamber of a microfluidic device.
II. MECHANOBIOLOGY AND TISSUE REGENERATION