Page 336 - Advances in Biomechanics and Tissue Regeneration
P. 336

334                           16. ON THE SIMULATION OF ORGAN-ON-CHIP CELL PROCESSES

                                x10 6                              x10 6
                               18                                18
                                                        S: Alive                          S: Alive
                               16                       S: Dead  16                       S: Dead
                                                        EXp: Alive                        Experimental
                               14
                              Cell concentration [c/mL]  12 8    Cell concentration [c/mL] 14 8
                                                                 12
                               10
                                                                 10

                               4 6                                6 4
                               2                                  2
                               0                                  0
                                0   0.05  0.1  0.15  0.2  0.25     0   0.05  0.1  0.15  0.2  0.25
                            (A)            Length [mm]
                                                                (B)           Length [mm]
                                x10 6                              x10 6
                               18                                18
                                                       S: Alive                           S: Alive
                               16                      S: Dead   16                       S: Dead
                                                       Experimental  14                   Experimental
                               14
                              Cell concentration [c/mL]  12 8    Cell concentration [c/mL]  12 8
                                                                 10
                               10

                               4 6                                6 4
                               2                                  2
                               0                                  0
                                0   0.05  0.1  0.15  0.2  0.25     0   0.05  0.1  0.15  0.2  0.25
                            (C)            Length [mm]         (D)            Length [mm]
                                                   x10 6
                                                 18
                                                                          S: Alive
                                                 16                       S: Dead
                                                                          Experimental
                                                 14
                                                 Cell concentration [c/mL]  12 8
                                                 10


                                                  4 6
                                                  2
                                                  0 0  0.05  0.1  0.15  0.2  0.25
                                               (E)            Length [mm]
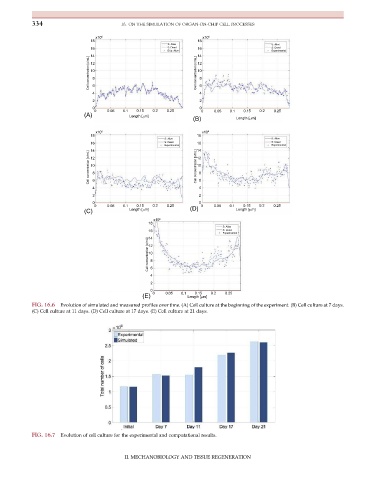
           FIG. 16.6  Evolution of simulated and measured profiles over time. (A) Cell culture at the beginning of the experiment. (B) Cell culture at 7 days.
           (C) Cell culture at 11 days. (D) Cell culture at 17 days. (E) Cell culture at 21 days.


           FIG. 16.7  Evolution of cell culture for the experimental and computational results.


                                          II. MECHANOBIOLOGY AND TISSUE REGENERATION
   331   332   333   334   335   336   337   338   339   340   341