
Page 71 - Advances in Biomechanics and Tissue Regeneration
P. 71
66 4. MECHANICAL AND MICROSTRUCTURAL BEHAVIOR OF VASCULAR TISSUE
TABLE 4.1 Mean and Standard Deviation of Collagen Fiber Orientation in Swine Carotid Artery Samples [27]
SD SD
ϕ r θ r κ 1, 2, 3
POSITIVE ELEVATION FAMILY
Proximal 90.0 8.5 8.7 5.0 [9.6, 0.0, 22.4]
Distal 91.8 7.8 8.8 3.8 [18.6, 0.0, 30.6]
NEGATIVE ELEVATION FAMILY
Proximal 89.0 7.5 8.8 5.0 [18.6, 0.0, 30.3]
Distal 90.8 8.3 7.7 0.5 [15.0, 0.0, 28.4]
4.2.1.2 Uniaxial Mechanical Test
Concerning the mechanical behavior, simple tension tests of the carotid strips were performed in a high precision
drive Instron Microtester 5548 system adapted for biological specimens [3]. Different loading and unloading cycles
were applied corresponding to approximately 60, 120, and 240 [kPa] stress levels at 30%/min of strain rate. Three pre-
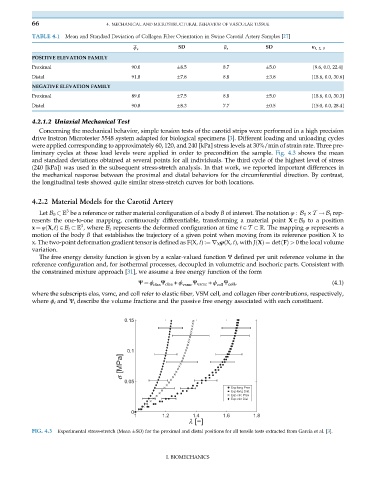
liminary cycles at those load levels were applied in order to precondition the sample. Fig. 4.3 shows the mean
and standard deviations obtained at several points for all individuals. The third cycle of the highest level of stress
(240 [kPa]) was used in the subsequent stress-stretch analysis. In that work, we reported important differences in
the mechanical response between the proximal and distal behaviors for the circumferential direction. By contrast,
the longitudinal tests showed quite similar stress-stretch curves for both locations.
4.2.2 Material Models for the Carotid Artery
3
Let B 0 be a reference or rather material configuration of a body B of interest. The notation φ : B 0 T ! B t rep-
resents the one-to-one mapping, continuously differentiable, transforming a material point X 2B 0 to a position
3
x ¼ φðX,tÞ2B t , where B t represents the deformed configuration at time t 2T . The mapping φ represents a
motion of the body B that establishes the trajectory of a given point when moving from its reference position X to
x. The two-point deformation gradient tensor is defined as F(X, t):¼r X φ(X, t), with JðXÞ¼ detðFÞ > 0 the local volume
variation.
The free energy density function is given by a scalar-valued function Ψ defined per unit reference volume in the
reference configuration and, for isothermal processes, decoupled in volumetric and isochoric parts. Consistent with
the constrained mixture approach [31], we assume a free energy function of the form
Ψ ¼ ϕ elas Ψ elas + ϕ vsmc Ψ vsmc + ϕ coll Ψ coll , (4.1)
where the subscripts elas, vsmc, and coll refer to elastic fiber, VSM cell, and collagen fiber contributions, respectively,
where ϕ i and Ψ i describe the volume fractions and the passive free energy associated with each constituent.
0.15
0.1
s [MPa]
0.05
Exp long Prox
Exp long Dist
Exp circ Prox
Exp circ Dist
0
1 1.2 1.4 1.6 1.8
l [−]
FIG. 4.3 Experimental stress-stretch (Mean SD) for the proximal and distal positions for all tensile tests extracted from García et al. [3].
I. BIOMECHANICS