
Page 75 - Advances in Biomechanics and Tissue Regeneration
P. 75
70 4. MECHANICAL AND MICROSTRUCTURAL BEHAVIOR OF VASCULAR TISSUE
0.15 0.15
0.1 0.1
s [MPa] s [MPa]
0.05 Fitted circ Prox 0.05 Fitted circ Prox
Fitted long Prox Fitted long Prox
Fitted circ Dist Fitted circ Dist
Fitted long Dist Fitted long Dist
To fit circ Prox To fit circ Prox
To fit circ Dist To fit circ Dist
To fit long Prox To fit long Prox
To fit long Dist To fit long Dist
0 0
1 1.2 1.4 1.6 1.8 1 1.2 1.4 1.6 1.8
(A) l [−] (B) l [−]
0.15 0.15
0.1 0.1
s [MPa] s [MPa]
0.05 Fitted circ Prox 0.05 Fitted circ Prox
Fitted long Prox Fitted long Prox
Fitted circ Dist Fitted circ Dist
Fitted long Dist Fitted long Dist
To fit circ Prox To fit circ Prox
To fit circ Dist To fit circ Dist
To fit long Prox To fit long Prox
To fit long Dist To fit long Dist
0 0
1 1.2 1.4 1.6 1.8 1 1.2 1.4 1.6 1.8
(C) l [−] (D) l [−]
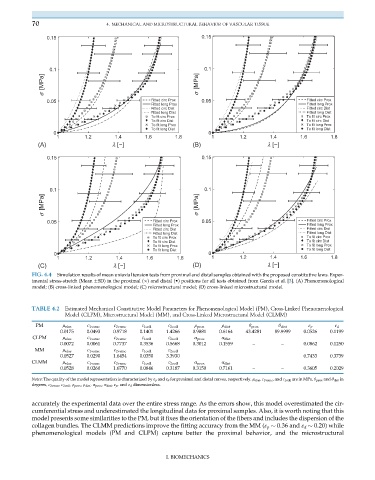
FIG. 4.4 Simulation results of mean uniaxial tension tests from proximal and distal samples obtained with the proposed constitutive laws. Exper-
imental stress-stretch (Mean SD) in the proximal ( ) and distal (•) positions for all tests obtained from García et al. [3]. (A) Phenomenological
model; (B) cross-linked phenomenological model; (C) microstructural model; (D) cross-linked microstructural model.
TABLE 4.2 Estimated Mechanical Constitutive Model Parameters for Phenomenological Model (PM), Cross-Linked Phenomenological
Model (CLPM), Microstructural Model (MM), and Cross-Linked Microstructural Model (CLMM)
PM μ elas c 1vsmc c 2vsmc c 1coll c 2coll ρ prox ρ dist θ prox θ dist ε p ε d
0.0175 0.0493 0.9718 0.1401 1.4266 0.9881 0.6164 43.4281 89.9999 0.0526 0.1199
CLPM μ elas c 1vsmc c 2vsmc c 1coll c 2coll α prox α dist
0.0072 0.0061 0.7737 0.3536 0.5668 0.3012 0.1559 – – 0.0862 0.1250
MM μ elas c 1vsmc c 2vsmc c 1coll c 2coll
0.0527 0.0290 1.6454 0.0350 3.3930 – – – – 0.7433 0.3739
CLMM μ elas c 1vsmc c 2vsmc c 1coll c 2coll α prox α dist
0.0528 0.0260 1.6770 0.0846 0.3187 0.3150 0.7161 – – 0.3605 0.2029
Notes: The quality of the model representation is characterized by ε p and ε d for proximal and distal curves, respectively. μ elas , c 1vsmc , and c 1coll are in MPa, θ prox and θ dist in
degrees, c 2vsmc , c 2coll , ρ prox , ρ dist , α prox , α dist , ε p , and ε d dimensionless.
accurately the experimental data over the entire stress range. As the errors show, this model overestimated the cir-
cumferential stress and underestimated the longitudinal data for proximal samples. Also, it is worth noting that this
model presents some similarities to the PM, but it fixes the orientation of the fibers and includes the dispersion of the
collagen bundles. The CLMM predictions improve the fitting accuracy from the MM (ε p 0.36 and ε d 0.20) while
phenomenological models (PM and CLPM) capture better the proximal behavior, and the microstructural
I. BIOMECHANICS