
Page 77 - Advances in Biomechanics and Tissue Regeneration
P. 77
72 4. MECHANICAL AND MICROSTRUCTURAL BEHAVIOR OF VASCULAR TISSUE
from approximately 3.5 0.6-month-old female pigs, sacrificed for other studies that did not interfere with the aorta or
the circulation system and processed in a histological laboratory to analyze their layered microconstituents [5]. Finally,
we also carried out several cyclic biaxial tension tests [4]. Details are illustrated in the following sections.
4.3.1.1 Biaxial Mechanical Test
Concerning the mechanical behavior, biaxial tests of the DTA samples were developed in Peña et al. [4]. Porcine
thoracic aortas (n ¼ 7) were harvested postmortem and square specimens, approximately 25 25 [mm], with their
sides aligned in the circumferential and axial directions were cut using a punch cutter and a scalpel. Tests were carried
out in an Instron BioPuls low-force planar-biaxial testing system. Square specimens were mounted in the planar-
biaxial machine by connecting four carriages by noddle clamps. Load-controlled tests were performed at peak tension
ratios in circumferential and longitudinal directions (P c :P l first Piola Kirchhoff stress tensor P) of 60:30, 30:60, and
60:60 kPa at stress rates of approximately 2 kPa/s [44]. Samples were preconditioned through 10 loading cycles for
each stress ratio, and the last cycle (10th) was used for subsequent analysis [4]. For the deformation measurements
during biaxial testing, several randomized markers were placed on the surface of the vessel and the lengths between
the two markers in each direction were measured by a Digital Image Correlation Strain Master LaVision System. Shear
strains were computed and were small; consequently, they were not accounted in the constitutive model.
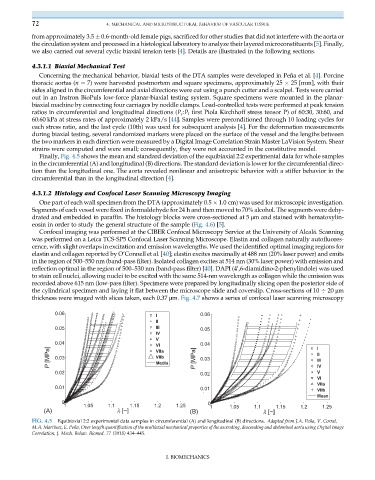
Finally, Fig. 4.5 shows the mean and standard deviation of the equibiaxial 2:2 experimental data for whole samples
in the circumferential (A) and longitudinal (B) directions. The standard deviation is lower for the circumferential direc-
tion than the longitudinal one. The aorta revealed nonlinear and anisotropic behavior with a stiffer behavior in the
circumferential than in the longitudinal direction [4].
4.3.1.2 Histology and Confocal Laser Scanning Microscopy Imaging
One part of each wall specimen from the DTA (approximately 0.5 1.0 cm) was used for microscopic investigation.
Segments of each vessel were fixed in formaldehyde for 24 h and then moved to 70% alcohol. The segments were dehy-
drated and embedded in paraffin. The histology blocks were cross-sectioned at 5 μm and stained with hematoxylin-
eosin in order to study the general structure of the sample (Fig. 4.6)[5].
Confocal imaging was performed at the CIBER Confocal Microscopy Service at the University of Alcalá. Scanning
was performed on a Leica TCS-SP5 Confocal Laser Scanning Microscope. Elastin and collagen naturally autofluores-
cence, with slight overlaps in excitation and emission wavelengths. We used the identified optimal imaging regions for
elastin and collagen reported by O’Connell et al. [40]; elastin excites maximally at 488 nm (20% laser power) and emits
in the region of 500–550 nm (band-pass filter). Isolated collagen excites at 514 nm (30% laser power) with emission and
reflection optimal in the region of 500–530 nm (band-pass filter) [40]. DAPI (4 ,6-diamidino-2-phenylindole) was used
0
to stain cell nuclei, allowing nuclei to be excited with the same 514-nm wavelength as collagen while the emission was
recorded above 615 nm (low-pass filter). Specimens were prepared by longitudinally slicing open the posterior side of
the cylindrical specimen and laying it flat between the microscope slide and coverslip. Cross-sections of 10 20 μm
thickness were imaged with slices taken, each 0.37 μm. Fig. 4.7 shows a series of confocal laser scanning microscopy
0.06
I 0.06
II
0.05 III 0.05
IV
V
0.04 0.04
VI I
P [MPa] 0.03 VIIb P [MPa] 0.03 II III
VIIa
Media
0.02 0.02 IV
V
VI
VIIa
0.01 0.01 VIIb
Mean
0 0
1 1.05 1.1 1.15 1.2 1.25 1 1.05 1.1 1.15 1.2 1.25
(A) l [−] (B) l [−]
FIG. 4.5 Equibiaxial 2:2 experimental data samples in circumferential (A) and longitudinal (B) directions. Adapted from J.A. Peña, V. Corral,
M.A. Martínez, E. Peña, Over length quantification of the multiaxial mechanical properties of the ascending, descending and abdominal aorta using Digital Image
Correlation, J. Mech. Behav. Biomed. 77 (2018) 434–445.
I. BIOMECHANICS