
Page 81 - Advances in Biomechanics and Tissue Regeneration
P. 81
76 4. MECHANICAL AND MICROSTRUCTURAL BEHAVIOR OF VASCULAR TISSUE
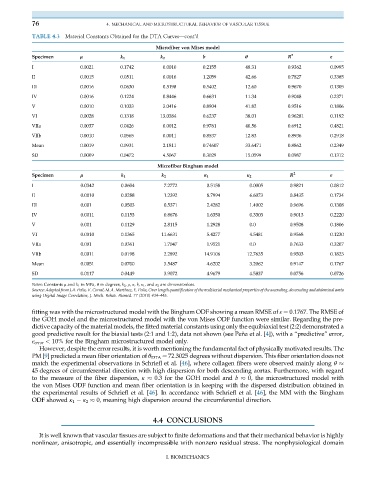
TABLE 4.3 Material Constants Obtained for the DTA Curves—cont’d
Microfiber von Mises model
Specimen μ k 1 k 2 b θ R 2 ε
I 0.0021 0.1742 0.0010 0.2155 48.31 0.9362 0.0995
II 0.0015 0.0511 0.0016 1.2059 42.66 0.7827 0.3385
III 0.0016 0.0630 0.5198 0.5402 12.60 0.9670 0.1305
IV 0.0016 0.1224 0.8446 0.6631 11.34 0.9048 0.2371
V 0.0010 0.1033 3.0416 0.8904 41.82 0.9516 0.1806
VI 0.0028 0.1318 13.0384 0.6237 38.01 0.96281 0.1192
VIIa 0.0037 0.0426 0.0012 0.9761 40.56 0.6912 0.4821
VIIb 0.0010 0.0565 0.0011 0.8537 12.83 0.8936 0.2918
Mean 0.0019 0.0931 2.1811 0.74607 33.6471 0.8862 0.2349
SD 0.0009 0.0472 4.5067 0.3029 15.0599 0.0987 0.1312
Microfiber Bingham model
Specimen μ k 1 k 2 κ 1 κ 2 R 2 ε
I 0.0342 0.0604 7.2772 0.5158 0.0005 0.9821 0.0812
II 0.0010 0.0288 1.2392 8.7994 6.6073 0.8435 0.1734
III 0.001 0.0503 0.5371 2.4282 1.4002 0.9696 0.1308
IV 0.0011 0.1153 0.8676 1.6350 0.3303 0.9013 0.2220
V 0.001 0.1129 2.8115 1.2928 0.0 0.9508 0.1806
VI 0.0010 0.1365 11.6631 5.4277 4.5481 0.9568 0.1230
VIIa 0.001 0.0361 1.7047 1.9521 0.0 0.7633 0.3207
VIIb 0.0011 0.0198 2.2892 14.9106 12.7635 0.9503 0.1823
Mean 0.0051 0.0700 3.5487 4.6202 3.2062 0.9147 0.1767
SD 0.0117 0.0449 3.9072 4.9679 4.5837 0.0756 0.0726
Notes: Constants μ and k 1 in MPa, θ in degrees, k 2 , ρ, κ, b, κ 1 ,and κ 2 are dimensionless.
Source: Adapted from J.A. Peña, V. Corral, M.A. Martínez, E. Peña, Over length quantification of the multiaxial mechanical properties of the ascending, descending and abdominal aorta
using Digital Image Correlation, J. Mech. Behav. Biomed. 77 (2018) 434–445.
fitting was with the microstructured model with the Bingham ODF showing a mean RMSE of ε ¼ 0.1767. The RMSE of
the GOH model and the microstructured model with the von Mises ODF function were similar. Regarding the pre-
dictive capacity of the material models, the fitted material constants using only the equibiaxial test (2:2) demonstrated a
good predictive result for the biaxial tests (2:1 and 1:2), data not shown (see Peña et al. [4]), with a “predictive” error,
ε error < 10% for the Bingham microstructured model only.
However, despite the error results, it is worth mentioning the fundamental fact of physically motivated results. The
PM [9] predicted a mean fiber orientation of θ DTA ¼ 72.3025 degrees without dispersion. This fiber orientation does not
match the experimental observations in Schriefl et al. [46], where collagen fibers were observed mainly along θ
45 degrees of circumferential direction with high dispersion for both descending aortas. Furthermore, with regard
to the measure of the fiber dispersion, κ 0.3 for the GOH model and b 0, the microstructured model with
the von Mises ODF function and mean fiber orientation is in keeping with the dispersed distribution obtained in
the experimental results of Schriefl et al. [46]. In accordance with Schriefl et al. [46], the MM with the Bingham
ODF showed κ 1 κ 2 0, meaning high dispersion around the circumferential direction.
4.4 CONCLUSIONS
It is well known that vascular tissues are subject to finite deformations and that their mechanical behavior is highly
nonlinear, anisotropic, and essentially incompressible with nonzero residual stress. The nonphysiological domain
I. BIOMECHANICS