
Page 26 - Advances in Eco-Fuels for a Sustainable Environment
P. 26
Introduction to sustainable and alternative ecofuels 3
Agency (USEPA) revealed that about 14% of total global greenhouse gas (GHG)
emissions were recorded in 2010 due to the usage of petroleum fuels in road, rail,
air, and marine transport [7]. In recent years, aviation biofuel and biodiesel have
become more attractive because of their excellent capability to mitigate adverse envi-
ronmental effects and to meet future energy security concerns by replacing some
energy produced from fossil fuels [8].
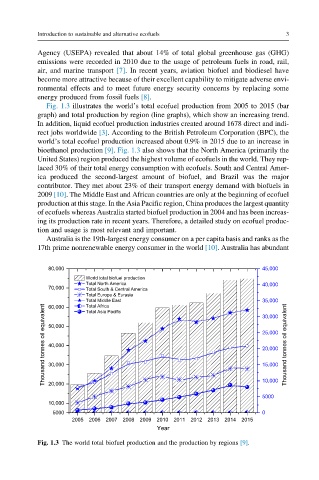
Fig. 1.3 illustrates the world’s total ecofuel production from 2005 to 2015 (bar
graph) and total production by region (line graphs), which show an increasing trend.
In addition, liquid ecofuel production industries created around 1678 direct and indi-
rect jobs worldwide [3]. According to the British Petroleum Corporation (BPC), the
world’s total ecofuel production increased about 0.9% in 2015 due to an increase in
bioethanol production [9]. Fig. 1.3 also shows that the North America (primarily the
United States) region produced the highest volume of ecofuels in the world. They rep-
laced 30% of their total energy consumption with ecofuels. South and Central Amer-
ica produced the second-largest amount of biofuel, and Brazil was the major
contributor. They met about 23% of their transport energy demand with biofuels in
2009 [10]. The Middle East and African countries are only at the beginning of ecofuel
production at this stage. In the Asia Pacific region, China produces the largest quantity
of ecofuels whereas Australia started biofuel production in 2004 and has been increas-
ing its production rate in recent years. Therefore, a detailed study on ecofuel produc-
tion and usage is most relevant and important.
Australia is the 19th-largest energy consumer on a per capita basis and ranks as the
17th prime nonrenewable energy consumer in the world [10]. Australia has abundant
80,000 45,000
World total biofuel production
Total North America 40,000
70,000 Total South & Central America
Total Europe & Eurasia
Total Middle East 35,000
Thousand tonnes oil equivalent 50,000 25,000 Thousand tonnes oil equivalent
Total Africa
60,000
Total Asia Pacific
30,000
40,000
20,000
15,000
30,000
10,000
20,000
5000
10,000
5000 0
2005 2006 2007 2008 2009 2010 2011 2012 2013 2014 2015
Year
Fig. 1.3 The world total biofuel production and the production by regions [9].