
Page 390 - Advances in Eco-Fuels for a Sustainable Environment
P. 390
344 Advances in Eco-Fuels for a Sustainable Environment
0.14
Diesel
0.13 B20 Ecofuel
0.12
0.11
Coefficient of friction (–) 0.09
0.10
0.08
0.07
0.06
0.05
0.04
0.03
200 400 800 1200 1600 2000 2400 2800 3200 3600
Time (s)
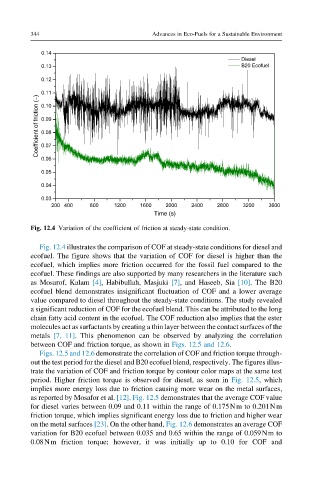
Fig. 12.4 Variation of the coefficient of friction at steady-state condition.
Fig. 12.4 illustrates the comparison of COF at steady-state conditions for diesel and
ecofuel. The figure shows that the variation of COF for diesel is higher than the
ecofuel, which implies more friction occurred for the fossil fuel compared to the
ecofuel. These findings are also supported by many researchers in the literature such
as Mosarof, Kalam [4], Habibullah, Masjuki [7], and Haseeb, Sia [10]. The B20
ecofuel blend demonstrates insignificant fluctuation of COF and a lower average
value compared to diesel throughout the steady-state conditions. The study revealed
a significant reduction of COF for the ecofuel blend. This can be attributed to the long
chain fatty acid content in the ecofuel. The COF reduction also implies that the ester
molecules act as surfactants by creating a thin layer between the contact surfaces of the
metals [7, 11]. This phenomenon can be observed by analyzing the correlation
between COF and friction torque, as shown in Figs. 12.5 and 12.6.
Figs. 12.5 and 12.6 demonstrate the correlation of COF and friction torque through-
out the test period for the diesel and B20 ecofuel blend, respectively. The figures illus-
trate the variation of COF and friction torque by contour color maps at the same test
period. Higher friction torque is observed for diesel, as seen in Fig. 12.5, which
implies more energy loss due to friction causing more wear on the metal surfaces,
as reported by Mosafor et al. [12]. Fig. 12.5 demonstrates that the average COF value
for diesel varies between 0.09 and 0.11 within the range of 0.175Nm to 0.201Nm
friction torque, which implies significant energy loss due to friction and higher wear
on the metal surfaces [23]. On the other hand, Fig. 12.6 demonstrates an average COF
variation for B20 ecofuel between 0.035 and 0.65 within the range of 0.059Nm to
0.08Nm friction torque; however, it was initially up to 0.10 for COF and