
Page 393 - Advances in Eco-Fuels for a Sustainable Environment
P. 393
Ecofuel and its compatibility with different automotive metals to assess diesel engine durability 347
12.3.4 Wear debris analysis by SEM
Wear debris analysis is one of the key techniques to evaluate wear particle counts and
measure their sizes for the tested fuels. This study was conducted using the wear debris
analysis by SEM/EDX on the filtered metal debris samples. The samples were col-
lected by filtering the oil from the four-ball tribotester. In the analysis of different
spots on the filter paper, mainly iron (Fe), chromium (Cr), silicon (Si), carbon (C),
and oxygen (O) were identified and recorded in average weight (%) and atomic
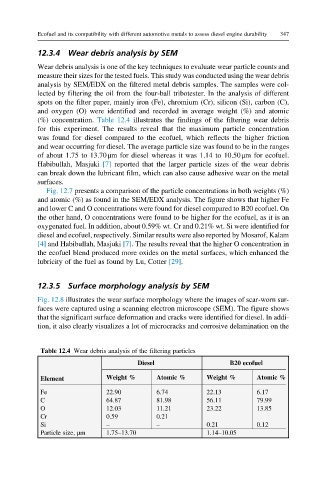
(%) concentration. Table 12.4 illustrates the findings of the filtering wear debris
for this experiment. The results reveal that the maximum particle concentration
was found for diesel compared to the ecofuel, which reflects the higher friction
and wear occurring for diesel. The average particle size was found to be in the ranges
of about 1.75 to 13.70μm for diesel whereas it was 1.14 to 10.50μm for ecofuel.
Habibullah, Masjuki [7] reported that the larger particle sizes of the wear debris
can break down the lubricant film, which can also cause adhesive wear on the metal
surfaces.
Fig. 12.7 presents a comparison of the particle concentrations in both weights (%)
and atomic (%) as found in the SEM/EDX analysis. The figure shows that higher Fe
and lower C and O concentrations were found for diesel compared to B20 ecofuel. On
the other hand, O concentrations were found to be higher for the ecofuel, as it is an
oxygenated fuel. In addition, about 0.59% wt. Cr and 0.21% wt. Si were identified for
diesel and ecofuel, respectively. Similar results were also reported by Mosarof, Kalam
[4] and Habibullah, Masjuki [7]. The results reveal that the higher O concentration in
the ecofuel blend produced more oxides on the metal surfaces, which enhanced the
lubricity of the fuel as found by Lu, Cotter [29].
12.3.5 Surface morphology analysis by SEM
Fig. 12.8 illustrates the wear surface morphology where the images of scar-worn sur-
faces were captured using a scanning electron microscope (SEM). The figure shows
that the significant surface deformation and cracks were identified for diesel. In addi-
tion, it also clearly visualizes a lot of microcracks and corrosive delamination on the
Table 12.4 Wear debris analysis of the filtering particles
Diesel B20 ecofuel
Weight % Atomic % Weight % Atomic %
Element
Fe 22.90 6.74 22.13 6.17
C 64.87 81.98 56.11 79.99
O 12.03 11.21 23.22 13.85
Cr 0.59 0.21 – –
Si – – 0.21 0.12
Particle size, μm 1.75–13.70 1.14–10.05