
Page 184 - Advances in Forensic Applications of Mass Spectrometry - Jehuda Yinon
P. 184
1522_C04.fm Page 167 Thursday, November 13, 2003 9:54 AM
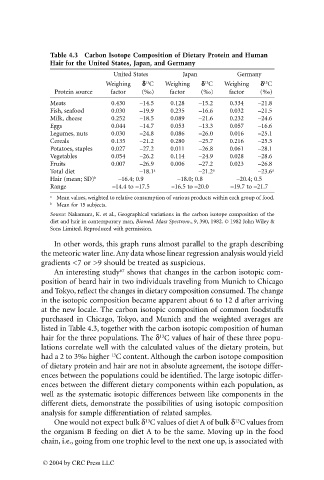
Table 4.3 Carbon Isotope Composition of Dietary Protein and Human
Hair for the United States, Japan, and Germany
United States Japan Germany
Weighing dd d d C Weighing dd d d C Weighing dd d d C
13
13
13
Protein source factor (‰) factor (‰) factor (‰)
Meats 0.430 –14.5 0.128 –15.2 0.334 –21.8
Fish, seafood 0.030 –19.9 0.235 –16.6 0.032 –21.5
Milk, cheese 0.252 –18.5 0.089 –21.6 0.232 –24.6
Eggs 0.044 –14.7 0.053 –13.3 0.057 –16.6
Legumes, nuts 0.030 –24.8 0.086 –26.0 0.016 –25.1
Cereals 0.135 –21.2 0.280 –25.7 0.216 –25.3
Potatoes, staples 0.027 –27.2 0.011 –26.8 0.061 –28.1
Vegetables 0.054 –26.2 0.114 –24.9 0.028 –28.6
Fruits 0.007 –26.9 0.006 –27.2 0.023 –26.8
Total diet –18.1 a –21.2 a –23.6 a
Hair (mean; SD) b –16.4; 0.9 –18.0; 0.8 –20.4; 0.5
Range –14.4 to –17.5 –16.5 to –20.0 –19.7 to –21.7
a Mean values, weighted to relative consumption of various products within each group of food.
b Mean for 15 subjects.
Source: Nakamura, K. et al., Geographical variations in the carbon isotope composition of the
diet and hair in contemporary man, Biomed. Mass Spectrom., 9, 390, 1982. © 1982 John Wiley &
Sons Limited. Reproduced with permission.
In other words, this graph runs almost parallel to the graph describing
the meteoric water line. Any data whose linear regression analysis would yield
gradients <7 or >9 should be treated as suspicious.
67
An interesting study shows that changes in the carbon isotopic com-
position of beard hair in two individuals traveling from Munich to Chicago
and Tokyo, reflect the changes in dietary composition consumed. The change
in the isotopic composition became apparent about 6 to 12 d after arriving
at the new locale. The carbon isotopic composition of common foodstuffs
purchased in Chicago, Tokyo, and Munich and the weighted averages are
listed in Table 4.3, together with the carbon isotopic composition of human
13
hair for the three populations. The d C values of hair of these three popu-
lations correlate well with the calculated values of the dietary protein, but
13
had a 2 to 3‰ higher C content. Although the carbon isotope composition
of dietary protein and hair are not in absolute agreement, the isotope differ-
ences between the populations could be identified. The large isotopic differ-
ences between the different dietary components within each population, as
well as the systematic isotopic differences between like components in the
different diets, demonstrate the possibilities of using isotopic composition
analysis for sample differentiation of related samples.
13
One would not expect bulk d C values of diet A of bulk d C values from
13
the organism B feeding on diet A to be the same. Moving up in the food
chain, i.e., going from one trophic level to the next one up, is associated with
© 2004 by CRC Press LLC