
Page 187 - Advances in Forensic Applications of Mass Spectrometry - Jehuda Yinon
P. 187
1522_C04.fm Page 170 Thursday, November 13, 2003 9:54 AM
30
20 Putumayo−Caqueta
Guaviare region
Putumayo–Caqueta 10
region δ 16 N + 0.1 Trux (‰)
Huallaga and Ucayali
Valleys 0
Apurimac Valley Apurimac
Guaviare
Chapare Valley −10
Huallaga−Ucayali
Chapare
−20
−150 −130 −110 −90 −70 −50 −30
13
δ C - 10 TMC (‰)
14
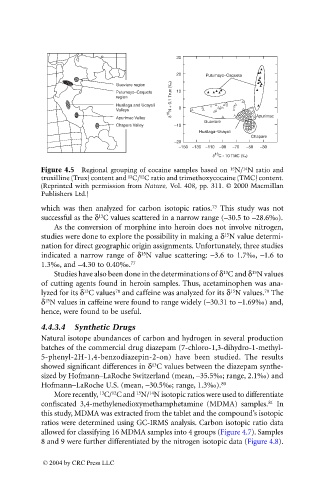
Figure 4.5 Regional grouping of cocaine samples based on N/ N ratio and
15
13
12
truxilline (Trux) content and C/ C ratio and trimethoxycocaine (TMC) content.
(Reprinted with permission from Nature, Vol. 408, pp. 311. © 2000 Macmillan
Publishers Ltd.)
which was then analyzed for carbon isotopic ratios. 73 This study was not
13
successful as the d C values scattered in a narrow range (–30.5 to –28.6‰).
As the conversion of morphine into heroin does not involve nitrogen,
studies were done to explore the possibility in making a d N value determi-
15
nation for direct geographic origin assignments. Unfortunately, three studies
indicated a narrow range of d N value scattering: –3.6 to 1.7‰, –1.6 to
15
1.3‰, and –4.30 to 0.40‰. 77
15
13
Studies have also been done in the determinations of d C and d N values
of cutting agents found in heroin samples. Thus, acetaminophen was ana-
78
79
15
13
lyzed for its d C values and caffeine was analyzed for its d N values. The
15
d N values in caffeine were found to range widely (–30.31 to –1.69‰) and,
hence, were found to be useful.
4.4.3.4 Synthetic Drugs
Natural isotope abundances of carbon and hydrogen in several production
batches of the commercial drug diazepam (7-chloro-1,3-dihydro-1-methyl-
5-phenyl-2H-1,4-benzodiazepin-2-on) have been studied. The results
showed significant differences in d C values between the diazepam synthe-
13
sized by Hofmann–LaRoche Switzerland (mean, –35.5‰; range, 2.1‰) and
Hofmann–LaRoche U.S. (mean, –30.5‰; range, 1.3‰). 80
15
12
13
14
More recently, C/ C and N/ N isotopic ratios were used to differentiate
confiscated 3,4-methylenedioxymethamphetamine (MDMA) samples. 81 In
this study, MDMA was extracted from the tablet and the compound’s isotopic
ratios were determined using GC-IRMS analysis. Carbon isotopic ratio data
allowed for classifying 16 MDMA samples into 4 groups (Figure 4.7). Samples
8 and 9 were further differentiated by the nitrogen isotopic data (Figure 4.8).
© 2004 by CRC Press LLC