
Page 297 - Advances in Forensic Applications of Mass Spectrometry - Jehuda Yinon
P. 297
1522_book.fm Page 268 Thursday, November 13, 2003 9:58 AM
9
APCI Chromatogram
Abundance 10
8
1000000
900000 7
3 4 11
800000
700000
600000 6
500000
400000
300000 1
200000
2
100000 13
0
Time->
0.00 2.00 4.00 6.00 8.00 10.00 12.00 14.00
Electrospray Chromatogram
Abundance
9
400000
6
8
350000
300000
1
250000 2
200000
150000
3
100000 7
50000
0
Time->
0.00 2.00 4.00 6.00 8.00 10.00 12.00 14.00
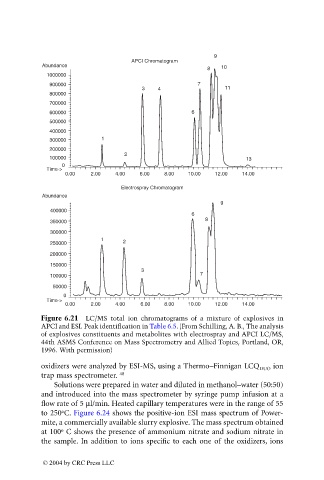
Figure 6.21 LC/MS total ion chromatograms of a mixture of explosives in
APCI and ESI. Peak identification in Table 6.5. (From Schilling, A. B., The analysis
of explosives constituents and metabolites with electrospray and APCI LC/MS,
44th ASMS Conference on Mass Spectrometry and Allied Topics, Portland, OR,
1996. With permission)
oxidizers were analyzed by ESI-MS, using a Thermo–Finnigan LCQ DUO ion
trap mass spectrometer. 48
Solutions were prepared in water and diluted in methanol–water (50:50)
and introduced into the mass spectrometer by syringe pump infusion at a
flow rate of 5 ml/min. Heated capillary temperatures were in the range of 55
o
to 250 C. Figure 6.24 shows the positive-ion ESI mass spectrum of Power-
mite, a commercially available slurry explosive. The mass spectrum obtained
o
at 100 C shows the presence of ammonium nitrate and sodium nitrate in
the sample. In addition to ions specific to each one of the oxidizers, ions
© 2004 by CRC Press LLC