
Page 105 - Advances in Renewable Energies and Power Technologies
P. 105
78 CHAPTER 3 Forecasting of Intermittent Solar Energy Resource
1. INTRODUCTION
The market growth of photovoltaic (PV) and wind energy systems over the last
decade has reached 50 GWp of PV plants and 62.7 GW of wind turbines installed
in 2015 (increasing 25% and 20% for PV and wind energy systems, respectively,
over that in 2014). The total capacity, respectively, in Europe and in the world has
reached 94.6 and 227 GW for PV [1] and 141.7 and 432.56 GW for wind energy
plants at the end of 2015 [2].
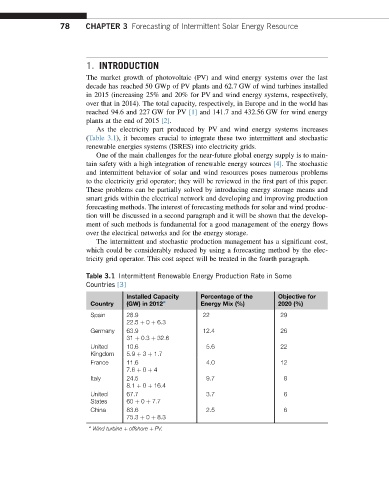
As the electricity part produced by PV and wind energy systems increases
(Table 3.1), it becomes crucial to integrate these two intermittent and stochastic
renewable energies systems (ISRES) into electricity grids.
One of the main challenges for the near-future global energy supply is to main-
tain safety with a high integration of renewable energy sources [4]. The stochastic
and intermittent behavior of solar and wind resources poses numerous problems
to the electricity grid operator; they will be reviewed in the first part of this paper.
These problems can be partially solved by introducing energy storage means and
smart grids within the electrical network and developing and improving production
forecasting methods. The interest of forecasting methods for solar and wind produc-
tion will be discussed in a second paragraph and it will be shown that the develop-
ment of such methods is fundamental for a good management of the energy flows
over the electrical networks and for the energy storage.
The intermittent and stochastic production management has a significant cost,
which could be considerably reduced by using a forecasting method by the elec-
tricity grid operator. This cost aspect will be treated in the fourth paragraph.
Table 3.1 Intermittent Renewable Energy Production Rate in Some
Countries [3]
Installed Capacity Percentage of the Objective for
Country (GW) in 2012 a Energy Mix (%) 2020 (%)
Spain 28.9 22 29
22.5 þ 0 þ 6.3
Germany 63.9 12.4 26
31 þ 0.3 þ 32.6
United 10.6 5.6 22
Kingdom 5.9 þ 3 þ 1.7
France 11.6 4.0 12
7.6 þ 0 þ 4
Italy 24.5 9.7 8
8.1 þ 0 þ 16.4
United 67.7 3.7 6
States 60 þ 0 þ 7.7
China 83.6 2.5 6
75.3 þ 0 þ 8.3
a
Wind turbine þ offshore þ PV.