
Page 227 - Advances in Renewable Energies and Power Technologies
P. 227
200 CHAPTER 5 DMPPT PV System: Modeling and Control Techniques
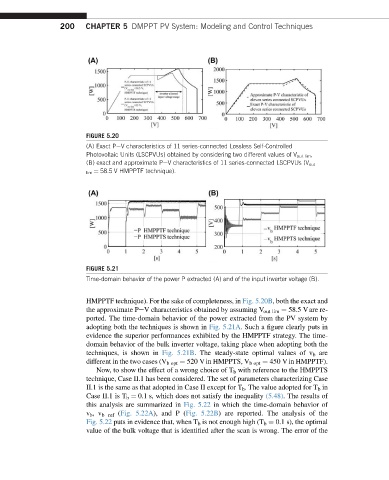
FIGURE 5.20
(A) Exact PeV characteristics of 11 series-connected Lossless Self-Controlled
Photovoltaic Units (LSCPVUs) obtained by considering two different values of V out lim ,
(B) exact and approximate PeV characteristics of 11 series-connected LSCPVUs (V out
lim ¼ 58.5 V HMPPTF technique).
FIGURE 5.21
Time-domain behavior of the power P extracted (A) and of the input inverter voltage (B).
HMPPTF technique). For the sake of completeness, in Fig. 5.20B, both the exact and
the approximate PeV characteristics obtained by assuming V out lim ¼ 58.5 Vare re-
ported. The time-domain behavior of the power extracted from the PV system by
adopting both the techniques is shown in Fig. 5.21A. Such a figure clearly puts in
evidence the superior performances exhibited by the HMPPTF strategy. The time-
domain behavior of the bulk inverter voltage, taking place when adopting both the
techniques, is shown in Fig. 5.21B. The steady-state optimal values of v b are
different in the two cases (V b opt ¼ 520 V in HMPPTS, V b opt ¼ 450 V in HMPPTF).
Now, to show the effect of a wrong choice of T b with reference to the HMPPTS
technique, Case II.1 has been considered. The set of parameters characterizing Case
II.1 is the same as that adopted in Case II except for T b . The value adopted for T b in
Case II.1 is T b ¼ 0.1 s, which does not satisfy the inequality (5.48). The results of
this analysis are summarized in Fig. 5.22 in which the time-domain behavior of
v b ,v b ref (Fig. 5.22A), and P (Fig. 5.22B) are reported. The analysis of the
Fig. 5.22 puts in evidence that, when T b is not enough high (T b ¼ 0.1 s), the optimal
value of the bulk voltage that is identified after the scan is wrong. The error of the