
Page 273 - Advances in Renewable Energies and Power Technologies
P. 273
246 CHAPTER 7 Strategies for Fault Detection and Diagnosis
climatic data and electrical parameters obtained from the monitoring system and cal-
culates the actual value of the real losses, L_meas.
When the PV system is in normal operation (absence of faults), the measured los-
ses remain into the theoretical boundaries given by the following equation:
L sim 2d < L meas < L sim þ 2d (7.33)
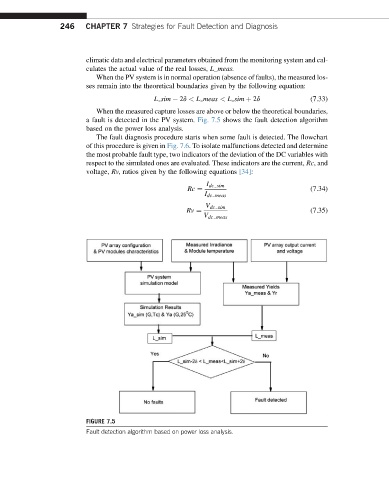
When the measured capture losses are above or below the theoretical boundaries,
a fault is detected in the PV system. Fig. 7.5 shows the fault detection algorithm
based on the power loss analysis.
The fault diagnosis procedure starts when some fault is detected. The flowchart
of this procedure is given in Fig. 7.6. To isolate malfunctions detected and determine
the most probable fault type, two indicators of the deviation of the DC variables with
respect to the simulated ones are evaluated. These indicators are the current, Rc, and
voltage, Rv, ratios given by the following equations [34]:
I dc sim
Rc ¼ (7.34)
I dc meas
V dc sim
Rv ¼ (7.35)
V dc meas
FIGURE 7.5
Fault detection algorithm based on power loss analysis.