
Page 274 - Advances in Renewable Energies and Power Technologies
P. 274
6. Fault Detection Procedures 247
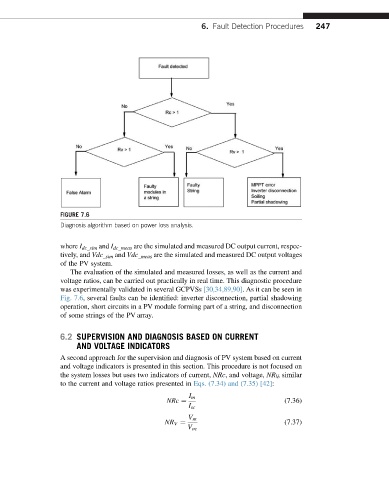
FIGURE 7.6
Diagnosis algorithm based on power loss analysis.
where I dc_sim and I dc_meas are the simulated and measured DC output current, respec-
tively, and Vdc _sim and Vdc _meas are the simulated and measured DC output voltages
of the PV system.
The evaluation of the simulated and measured losses, as well as the current and
voltage ratios, can be carried out practically in real time. This diagnostic procedure
was experimentally validated in several GCPVSs [30,34,89,90]. As it can be seen in
Fig. 7.6, several faults can be identified: inverter disconnection, partial shadowing
operation, short circuits in a PV module forming part of a string, and disconnection
of some strings of the PV array.
6.2 SUPERVISION AND DIAGNOSIS BASED ON CURRENT
AND VOLTAGE INDICATORS
A second approach for the supervision and diagnosis of PV system based on current
and voltage indicators is presented in this section. This procedure is not focused on
the system losses but uses two indicators of current, NRc, and voltage, NR V , similar
to the current and voltage ratios presented in Eqs. (7.34) and (7.35) [42]:
I m
NRc ¼ (7.36)
I sc
V m
NR V ¼ (7.37)
V oc