
Page 303 - Advances in Renewable Energies and Power Technologies
P. 303
276 CHAPTER 8 Hybrid PV/Batteries Bank/Diesel Generator
overall system cost criterion. However, the choice of optimization condition depends
on the requirement of the system deployment: minimum cost or minimum pollution.
3.3 ECONOMICS OF A HYBRID RENEWABLE ENERGY SYSTEM:
CASE STUDY
Electricity can be supplied to a load using a DE alone, using PVand storage batteries
alone, or by using a hybrid PV/batteries bank/DG system. To compare the eco-
nomics of these three different options, a case study of an off-grid connected load
located in Tunisia is considered [9]. Forty-two 300-W PV solar panels and 120 bat-
teries each of 12 V/100 Ah are used in the analysis of this study case. The cost of a
PV solar panel and a battery are assumed to be $270 US and $272 US, respectively.
Details of the case study are described in Section 5.
The overall system cost of each option of power supply to the load are calculated,
analyzed, and compared in three different countries: Tunisia, Jordan, and Saudi
Arabia. Jordan is chosen because it has similar economic situation like Tunisia while
Saudi Arabia is chosen because the oil price is subsidized there. The load power dur-
ing every hour, solar irradiation, and ambient temperature are considered as inputs to
the simulation algorithm while the PVoutput power, batteries dod value, and the DG
power (Pdiesel) are considered as outputs. Fig. 8.9 shows the sun irradiation and
Fig. 8.10 illustrates the ambient temperature for an arbitrary day in the month of
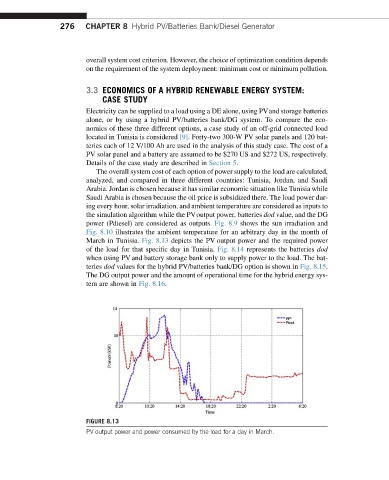
March in Tunisia. Fig. 8.13 depicts the PV output power and the required power
of the load for that specific day in Tunisia. Fig. 8.14 represents the batteries dod
when using PV and battery storage bank only to supply power to the load. The bat-
teries dod values for the hybrid PV/batteries bank/DG option is shown in Fig. 8.15.
The DG output power and the amount of operational time for the hybrid energy sys-
tem are shown in Fig. 8.16.
FIGURE 8.13
PV output power and power consumed by the load for a day in March.