
Page 388 - Advances in Renewable Energies and Power Technologies
P. 388
3. Energy Management for Photovoltaic Installations 361
R aux
K 4
P pv
K 2
K 1 K 3
P FC
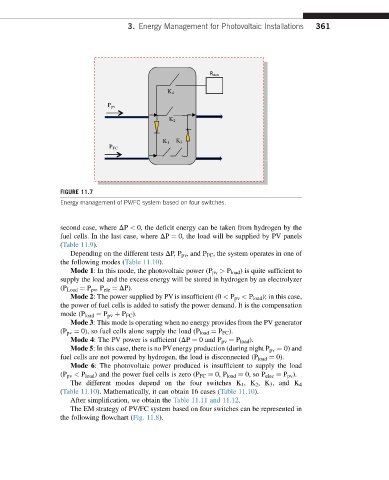
FIGURE 11.7
Energy management of PV/FC system based on four switches.
second case, where DP < 0, the deficit energy can be taken from hydrogen by the
fuel cells. In the last case, where DP ¼ 0, the load will be supplied by PV panels
(Table 11.9).
Depending on the different tests DP, P pv , and P FC , the system operates in one of
the following modes (Table 11.10).
Mode 1: In this mode, the photovoltaic power (P pv > P load ) is quite sufficient to
supply the load and the excess energy will be stored in hydrogen by an electrolyzer
(P Load ¼ P pv ,P ele ¼ DP).
Mode 2: The power supplied by PV is insufficient (0 < P pv < P load ); in this case,
the power of fuel cells is added to satisfy the power demand. It is the compensation
mode (P load ¼ P pv þ P FC ).
Mode 3: This mode is operating when no energy provides from the PV generator
(P pv ¼ 0), so fuel cells alone supply the load (P load ¼ P FC ).
Mode 4: The PV power is sufficient (DP ¼ 0 and P pv ¼ P load ).
Mode 5: In this case, there is no PVenergy production (during night P pv ¼ 0) and
fuel cells are not powered by hydrogen, the load is disconnected (P load ¼ 0).
Mode 6: The photovoltaic power produced is insufficient to supply the load
(P pv < P load ) and the power fuel cells is zero (P FC ¼ 0, P load ¼ 0, so P elec ¼ P pv ).
The different modes depend on the four switches K 1 ,K 2 ,K 3 , and K 4
(Table 11.10). Mathematically, it can obtain 16 cases (Table 11.10).
After simplification, we obtain the Table 11.11 and 11.12.
The EM strategy of PV/FC system based on four switches can be represented in
the following flowchart (Fig. 11.8).