
Page 54 - Advances in Renewable Energies and Power Technologies
P. 54
4. The Solar Cells 27
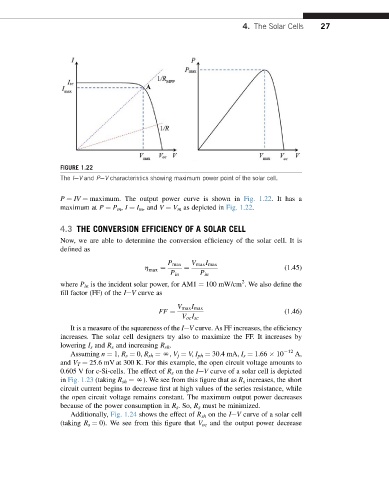
FIGURE 1.22
The IeV and PeV characteristics showing maximum power point of the solar cell.
P ¼ IV ¼ maximum. The output power curve is shown in Fig. 1.22. It has a
maximum at P ¼ P m , I ¼ I m , and V ¼ V m as depicted in Fig. 1.22.
4.3 THE CONVERSION EFFICIENCY OF A SOLAR CELL
Now, we areabletodetermine theconversionefficiency of thesolar cell.Itis
defined as
P max V max I max
h max ¼ ¼ (1.45)
P in P in
2
where P in is the incident solar power, for AM1 ¼ 100 mW/cm . We also define the
fill factor (FF) of the IeV curve as
V max I max
FF ¼ (1.46)
V oc I sc
It is a measure of the squareness of the IeV curve. As FF increases, the efficiency
increases. The solar cell designers try also to maximize the FF. It increases by
lowering I s and R s and increasing R sh .
12
Assuming n ¼ 1, R s ¼ 0, R sh ¼ N, V j ¼ V, I ph ¼ 30.4 mA, I s ¼ 1.66 10 A,
and V T ¼ 25.6 mV at 300 K. For this example, the open circuit voltage amounts to
0.605 V for c-Si-cells. The effect of R s on the IeV curve of a solar cell is depicted
in Fig. 1.23 (taking R sh ¼ N). We see from this figure that as R s increases, the short
circuit current begins to decrease first at high values of the series resistance, while
the open circuit voltage remains constant. The maximum output power decreases
because of the power consumption in R s .So, R s must be minimized.
Additionally, Fig. 1.24 shows the effect of R sh on the IeV curve of a solar cell
(taking R s ¼ 0). We see from this figure that V oc and the output power decrease