
Page 56 - Advances in Renewable Energies and Power Technologies
P. 56
4. The Solar Cells 29
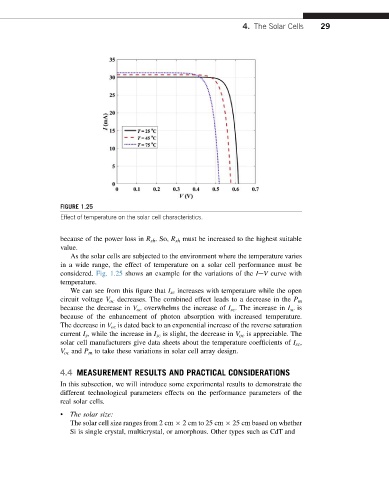
FIGURE 1.25
Effect of temperature on the solar cell characteristics.
because of the power loss in R sh .So, R sh must be increased to the highest suitable
value.
As the solar cells are subjected to the environment where the temperature varies
in a wide range, the effect of temperature on a solar cell performance must be
considered. Fig. 1.25 shows an example for the variations of the IeV curve with
temperature.
We can see from this figure that I sc increases with temperature while the open
circuit voltage V oc decreases. The combined effect leads to a decrease in the P m
because the decrease in V oc overwhelms the increase of I sc . The increase in I sc is
because of the enhancement of photon absorption with increased temperature.
The decrease in V oc is dated back to an exponential increase of the reverse saturation
current I s , while the increase in I sc is slight, the decrease in V oc is appreciable. The
solar cell manufacturers give data sheets about the temperature coefficients of I sc ,
V oc and P m to take these variations in solar cell array design.
4.4 MEASUREMENT RESULTS AND PRACTICAL CONSIDERATIONS
In this subsection, we will introduce some experimental results to demonstrate the
different technological parameters effects on the performance parameters of the
real solar cells.
• The solar size:
The solar cell size ranges from 2 cm 2cm to 25cm 25 cm based on whether
Si is single crystal, multicrystal, or amorphous. Other types such as CdT and