Page 234 - Air Pollution Control Engineering
P. 234

05_chap_wang.qxd  05/05/2004  3:46 pm  Page 213
                    Wet and Dry Scrubbing                                                     213

                    Tables 5
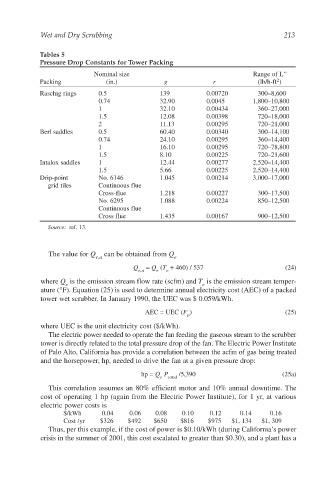
                    Pressure Drop Constants for Tower Packing
                                    Nominal size                                    Range of L''
                                                                                           2
                    Packing             (in.)            g              r             (lb/h-ft )
                    Raschig rings     0.5               139           0.00720         300–8,600
                                      0.74              32.90         0.0045        1,800–10,800
                                      1                 32.10         0.00434         360–27,000
                                      1.5               12.08         0.00398         720–18,000
                                      2                 11.13         0.00295         720–21,000
                    Berl saddles      0.5               60.40         0.00340         300–14,100
                                      0.74              24.10         0.00295         360–14,400
                                      1                 16.10         0.00295         720–78,800
                                      1.5               8.10          0.00225         720–21,600
                    Intalox saddles   1                 12.44         0.00277       2,520–14,400
                                      1.5               5.66          0.00225       2,520–14,400
                    Drip-point        No. 6146          1.045         0.00214       3,000–17,000
                       grid tiles     Continuous flue
                                      Cross-flue        1.218         0.00227         300–17,500
                                      No. 6295          1.088         0.00224         850–12,500
                                      Continuous flue
                                      Cross flue        1.435         0.00167         900–12,500
                       Source: ref. 13.


                       The value for Q  can be obtained from Q
                                     e,a                    e
                                                Q   = Q (T + 460) / 537                       (24)
                                                  e,a  e  e
                    where Q is the emission stream flow rate (scfm) and T is the emission stream temper-
                            e                                        e
                    ature (°F). Equation (25) is used to determine annual electricity cost (AEC) of a packed
                    tower wet scrubber. In January 1990, the UEC was $ 0.059/kWh.

                                                    AEC = UEC (F )                            (25)
                                                                p
                    where UEC is the unit electricity cost ($/kWh).
                       The electric power needed to operate the fan feeding the gaseous stream to the scrubber
                    tower is directly related to the total pressure drop of the fan. The Electric Power Institute
                    of Palo Alto, California has provide a correlation between the acfm of gas being treated
                    and the horsepower, hp, needed to drive the fan at a given pressure drop:
                                                   hp = Q P   /5,390                         (25a)
                                                        e  total
                       This correlation assumes an 80% efficient motor and 10% annual downtime. The
                    cost of operating 1 hp (again from the Electric Power Institute), for 1 yr, at various
                    electric power costs is
                           $/kWh       0.04    0.06    0.08    0.10    0.12     0.14     0.16
                           Cost /yr   $326     $492   $650    $816     $975   $1, 134  $1, 309
                       Thus, per this example, if the cost of power is $0.10/kWh (during California’s power
                    crisis in the summer of 2001, this cost escalated to greater than $0.30), and a plant has a
   229   230   231   232   233   234   235   236   237   238   239