
Page 48 - Air Pollution Control Engineering
P. 48
01_chap_wang.qxd 05/05/2004 11:46 am Page 28
28 Lawrence K. Wang et al.
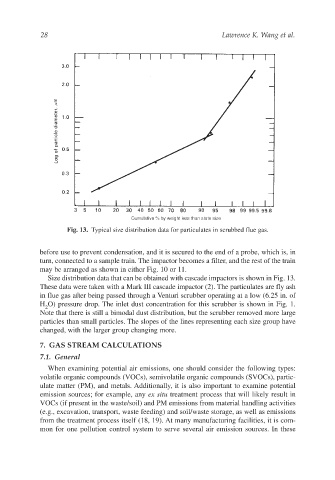
Fig. 13. Typical size distribution data for particulates in scrubbed flue gas.
before use to prevent condensation, and it is secured to the end of a probe, which is, in
turn, connected to a sample train. The impactor becomes a filter, and the rest of the train
may be arranged as shown in either Fig. 10 or 11.
Size distribution data that can be obtained with cascade impactors is shown in Fig. 13.
These data were taken with a Mark III cascade impactor (2). The particulates are fly ash
in flue gas after being passed through a Venturi scrubber operating at a low (6.25 in. of
H O) pressure drop. The inlet dust concentration for this scrubber is shown in Fig. 1.
2
Note that there is still a bimodal dust distribution, but the scrubber removed more large
particles than small particles. The slopes of the lines representing each size group have
changed, with the larger group changing more.
7. GAS STREAM CALCULATIONS
7.1. General
When examining potential air emissions, one should consider the following types:
volatile organic compounds (VOCs), semivolatile organic compounds (SVOCs), partic-
ulate matter (PM), and metals. Additionally, it is also important to examine potential
emission sources; for example, any ex situ treatment process that will likely result in
VOCs (if present in the waste/soil) and PM emissions from material handling activities
(e.g., excavation, transport, waste feeding) and soil/waste storage, as well as emissions
from the treatment process itself (18, 19). At many manufacturing facilities, it is com-
mon for one pollution control system to serve several air emission sources. In these